
The EUR/USD currency pair
Technical indicators of the currency pair:
Prev Open: 1.13861
Open: 1.14066
% chg. over the last day: +0.09
Day’s range: 1.13990 – 1.14246
52 wk range: 1.1299 – 1.2557
There is an ambiguous technical pattern on the EUR/USD currency pair. At the moment, the EUR/USD quotes are consolidating. Local levels of support and resistance are 1.14000 and 1.14250, respectively. Investors took a wait-and-see attitude before the midterm elections in the United States and the Fed’s meeting. We recommend opening positions from key levels.
The news feed on 06.11.2018:
At 17:00 (GMT+2:00) the data on the number of open jobs in the JOLTS labor market will be published.
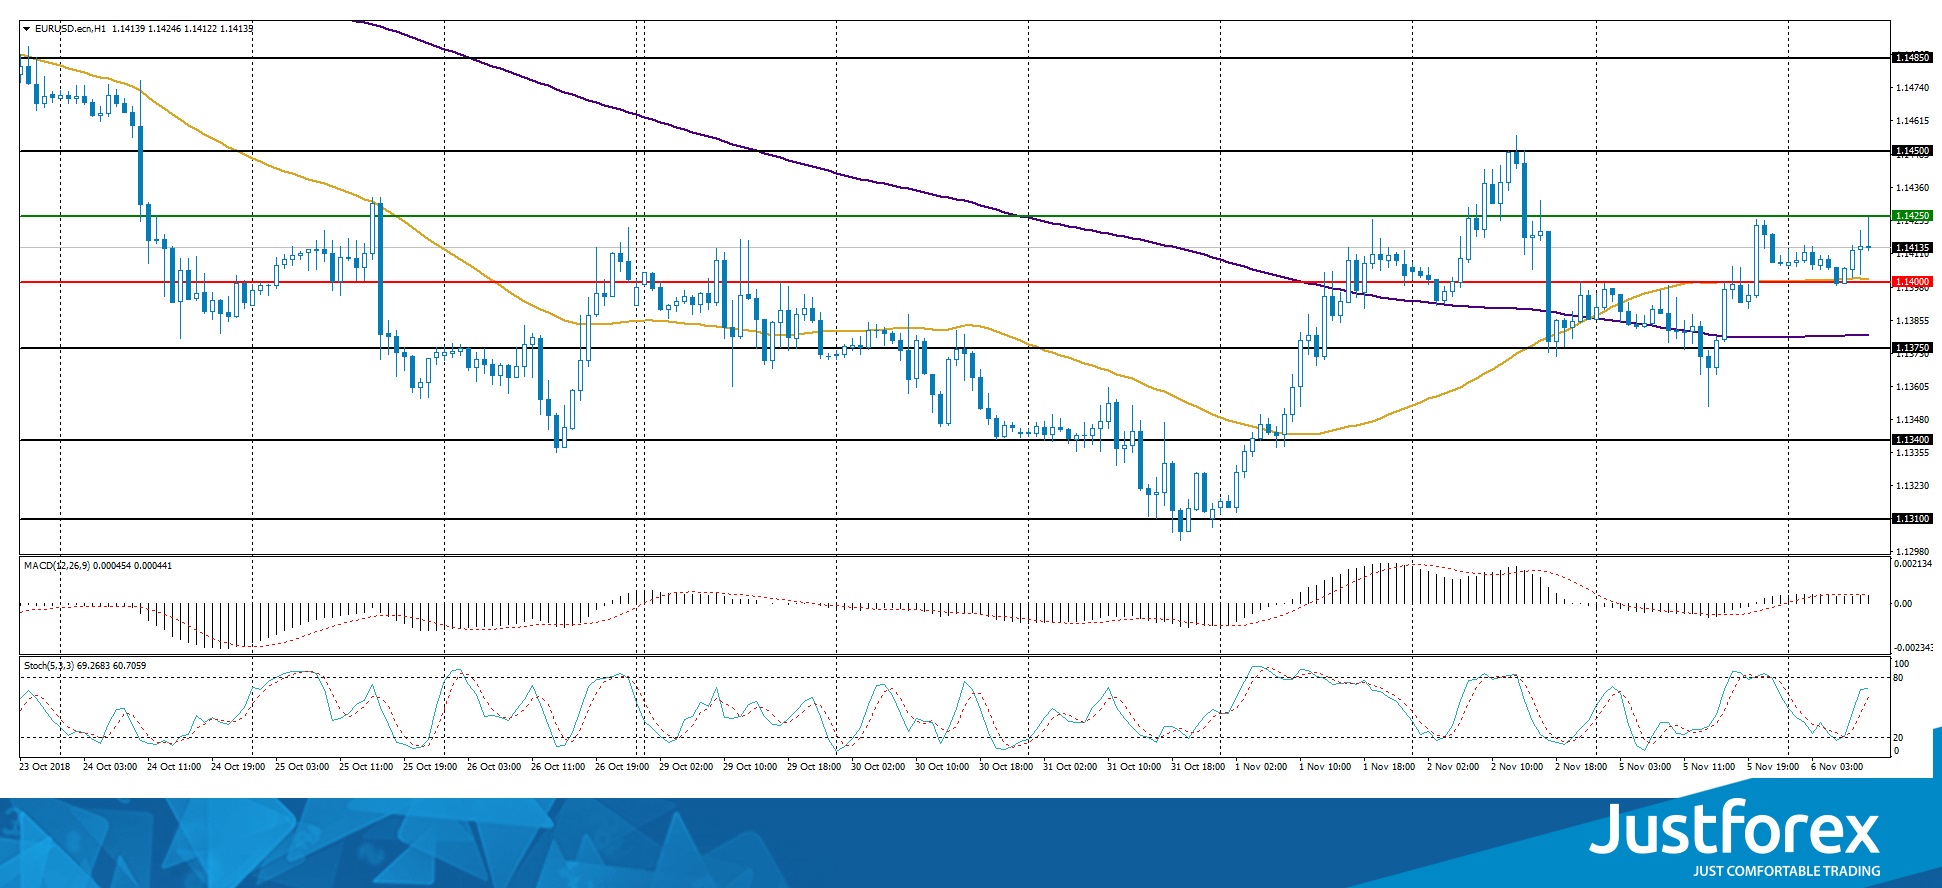
Indicators point to the power of buyers: the price has fixed above 50 MA and 200 MA.
The MACD histogram is in the positive zone, but below the signal line, which gives a weak signal to buy EUR/USD.
Stochastic Oscillator is in the neutral zone, the %K line is above the %D line, which indicates the bullish sentiment.
Trading recommendations
Support levels: 1.14000, 1.13750, 1.13400
Resistance levels: 1.14250, 1.14500, 1.14850
If the price fixes above the resistance level of 1.14250, the EUR/USD currency pair is expected to grow. The movement is tending to 1.14500-1.14800.
Alternative option. If the price fixes below 1.14000, you need to look for entry points to the market in order to open short positions. The movement is tending to 1.13750-1.13500.
The GBP/USD currency pair
Technical indicators of the currency pair:
Prev Open: 1.30215
Open: 1.30330
% chg. over the last day: +0.40
Day’s range: 1.30289 – 1.30851
52 wk range: 1.2662 – 1.4378
The GBP/USD currency pair continues to show a positive trend. During yesterday’s and today’s trading, the growth of quotations exceeded 70 points. At the moment, the pound is testing a local resistance of 1.30800. The mark of 1.30300 is already a “mirror” support. Positive news about Brexit supports the demand on pound. Trading instrument is tending to grow.
The news feed on the UK economy is calm.
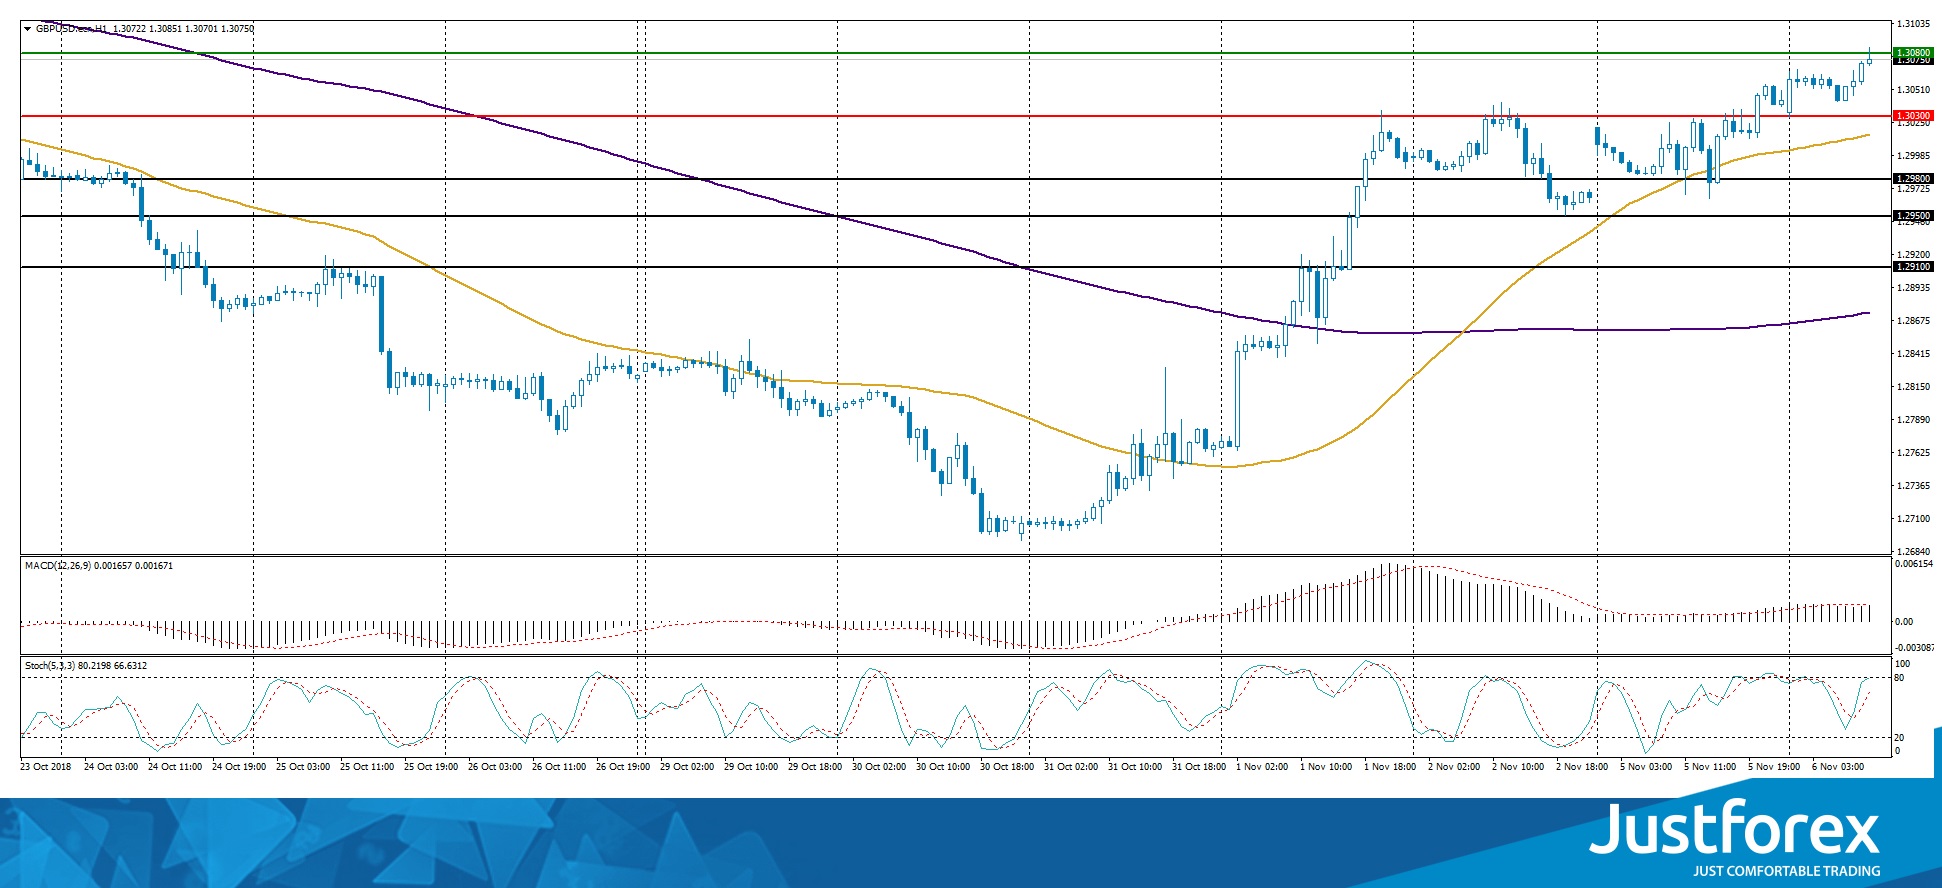
Indicators point to the power of buyers: the price has fixed above 50 MA and 200 MA.
The MACD histogram is in the positive zone and continues to rise, which gives a strong signal to buy GBP/USD
Stochastic Oscillator is in the neutral zone, the %K line is above the %D line, which indicates the bullish sentiment.
Trading recommendations
Support levels: 1.30300, 1.29800, 1.29500
Resistance levels: 1.30800, 1.31400
If the price fixes above the resistance level of 1.30800, further growth of the GBP/USD currency pair is expected. The movement is tending to 1.31200-1.31400.
An alternative could be a drop in the GBP/USD quotes to the level of 1.30000-1.29800.
The USD/CAD currency pair
Technical indicators of the currency pair:
Prev Open: 1.30879
Open: 1.31087
% chg. over the last day: +0.08
Day’s range: 1.30943 – 1.31160
52 wk range: 1.2248 – 1.3387
The USD/CAD currency pair is still being traded in the flat. The technical pattern is ambiguous. The USD/CAD quotes are testing local support and resistance levels: 1.30850 and 1.31200, respectively. Positions must be opened from these marks. Investors expect additional drivers. We recommend paying attention to the news feed from the United States.
At 15:30 (GMT+2:00) data on building permits in Canada will be published.
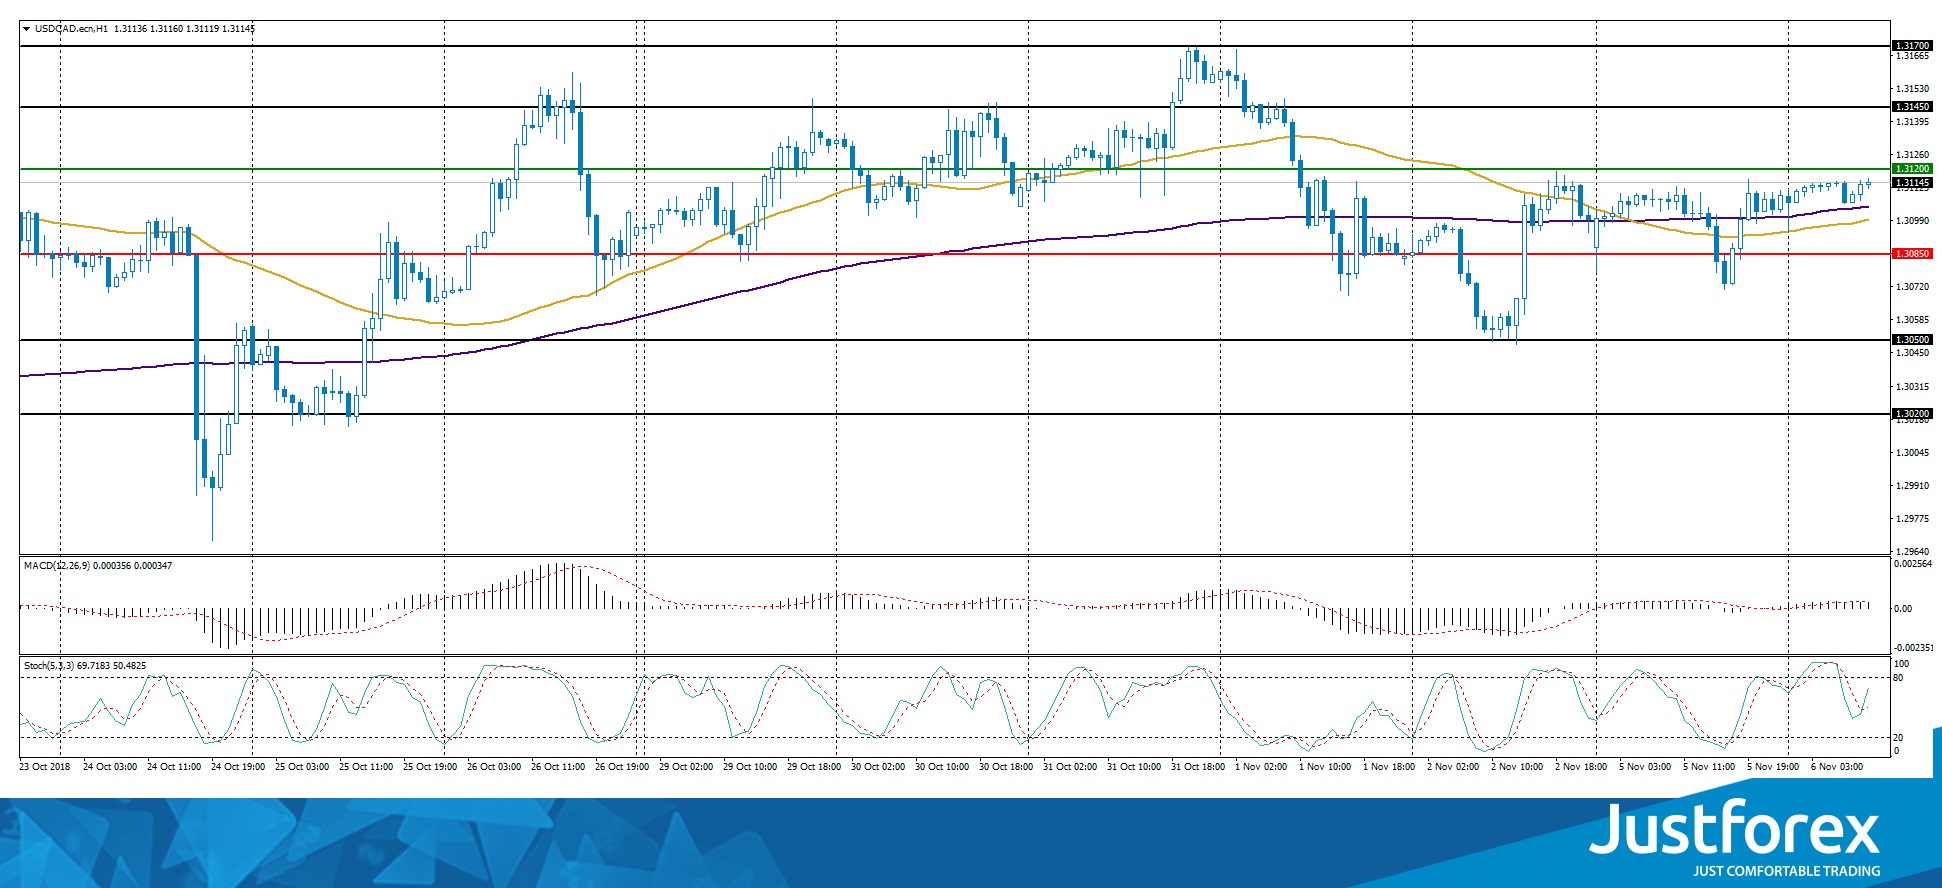
Indicators do not send accurate signals: 50 MA has crossed 200 MA.
The MACD histogram is in the positive zone, but below the signal line, which gives a weak signal to buy USD/CAD.
Stochastic Oscillator is in the neutral zone, the %K line has crossed the %D line. There are no signals at the moment.
Trading recommendations
Support levels: 1.30850, 1.30500, 1.30200
Resistance levels: 1.31200, 1.31450, 1.31700
If the price fixes below the support of 1.30850, the USD/CAD quotes are expected to fall. The movement is tending to 1.30500-1.30300.
An alternative could be the growth of the USD/CAD currency pair to the level of 1.31450-1.31700.
The USD/JPY currency pair
Technical indicators of the currency pair:
Prev Open: 113.148
Open: 113.192
% chg. over the last day: +0.12
Day’s range: 113.161 – 113.446
52 wk range: 104.56 – 114.74
The USD/JPY currency pair is still in the flat. Unidirectional trend is not observed. Currently, the local support and resistance levels are: 113.100 and 113.400, respectively. Financial market participants expect additional drivers. We recommend paying attention to the news feed and the dynamics of US government bonds. Positions must be opened from key levels.
The news feed on the economy of Japan is quite calm.
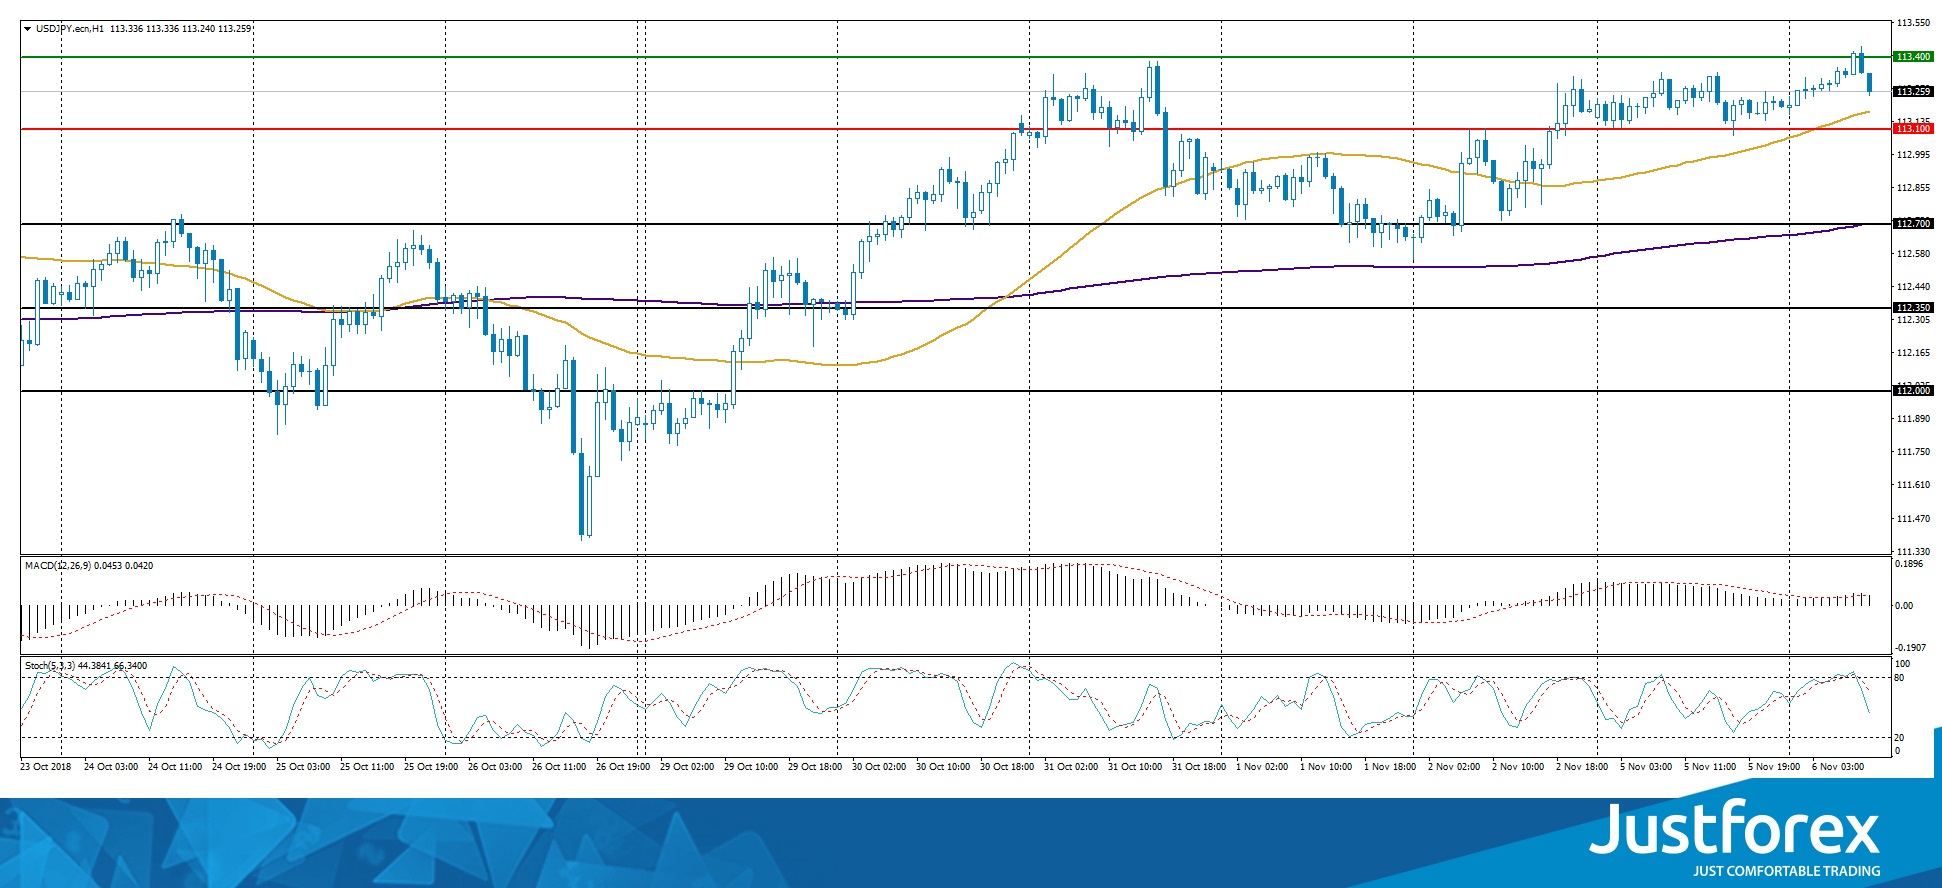
The price has fixed above 50 MA and 200 MA, which indicates the power of buyers.
The MACD histogram is in the positive zone, but below the signal line, which gives a weak signal to buy USD/JPY.
Stochastic Oscillator is in the neutral zone, the %K line is below the %D line, which indicates the bearish sentiment.
Trading recommendations
Support levels: 113.000, 112.650, 112.350
Resistance levels: 113.400, 113.700, 114.000
If the price fixes above the resistance level of 113.400, the growth of the USD/JPY quotes is expected. The movement is tending to 113.700-114.000.
An alternative could be a decrease in the USD/JPY currency pair to 112.700-112.500.


