
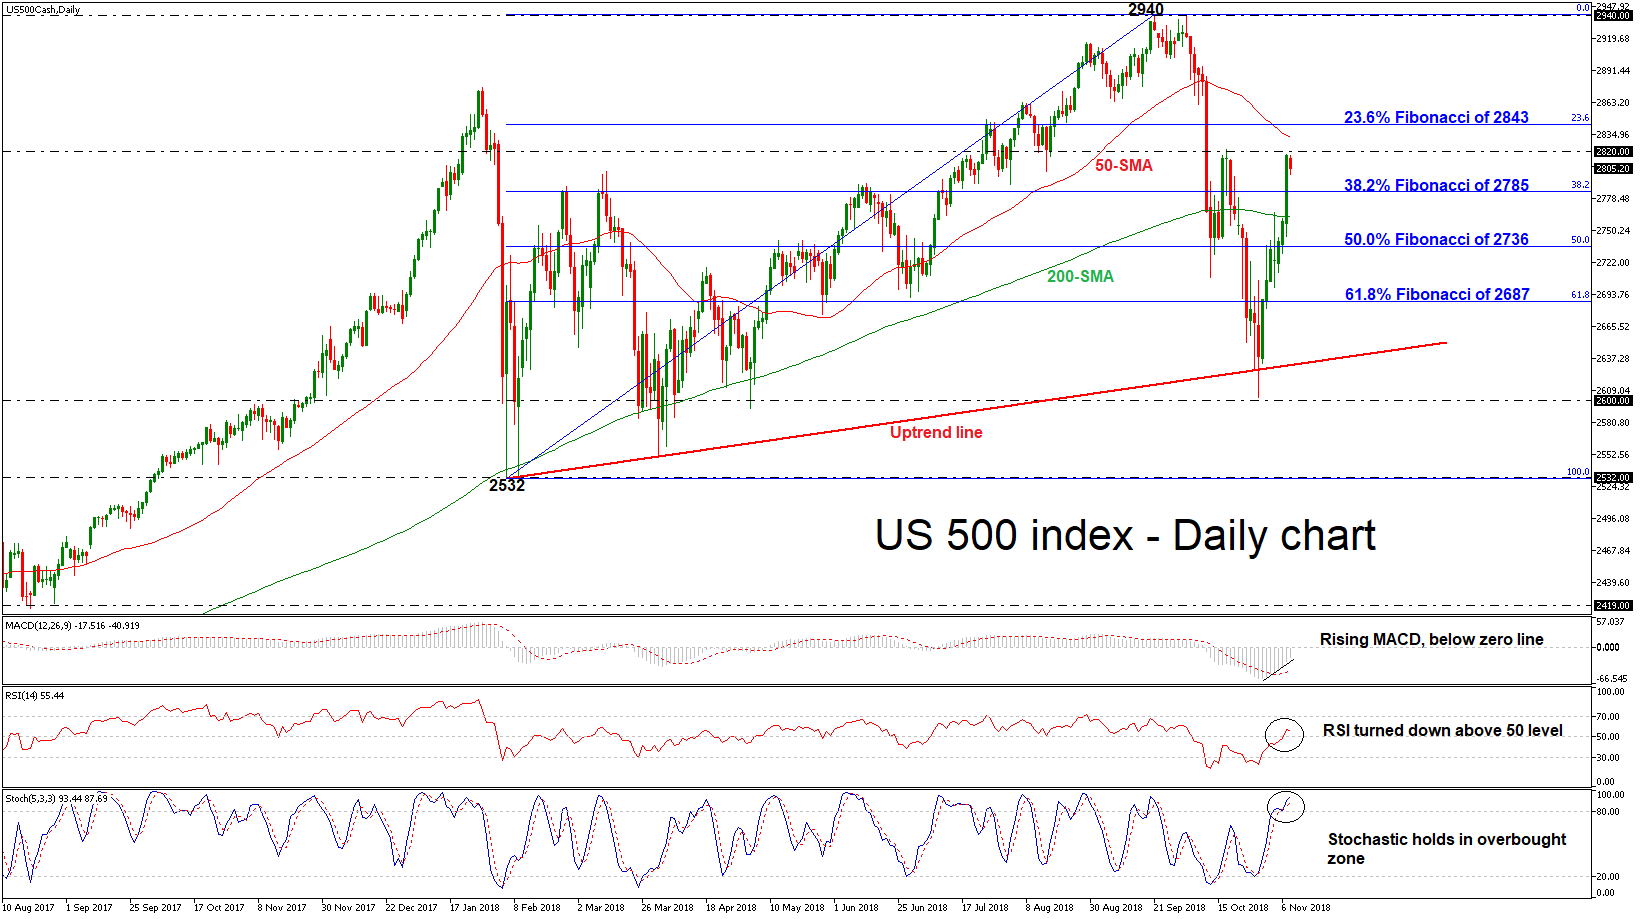
The US 500 index recorded considerable gains at the end of October and early in November, following the rebound on the 2600 support. The index has now crossed back above its 200-day simple moving average (SMA), which keeps the broader outlook cautiously positive.
Looking at short-term oscillators, the RSI is pointing downwards albeit above its neutral 50 level, detecting possible downside momentum. However, the MACD is moving higher in the negative territory, suggesting more gains. The stochastic oscillator is also pointing to positive momentum as it stands in the overbought zone in the daily timeframe.
Immediate resistance is coming from the 2820 barrier, taken from the latest highs, while slightly higher the 23.6% Fibonacci retracement level of the upleg from 2532 to 2940, around 2843 could act as major obstacle for the bulls. An upside break may see scope for advances towards the all-time high of 2940, achieved on October 3.
On the flipside, a reversal of the recovery in the market may meet initial support around the 38.2% Fibonacci of 2785. A downside break would send prices towards the 50.0% Fibonacci of 2736, with even steeper bearish extension eyeing the 61.8% Fibonacci of 2687.
To conclude, as long as the index continues to trade above the long-term upside support line, which has been holding since February 6 the bigger picture remains cautiously bullish.


