
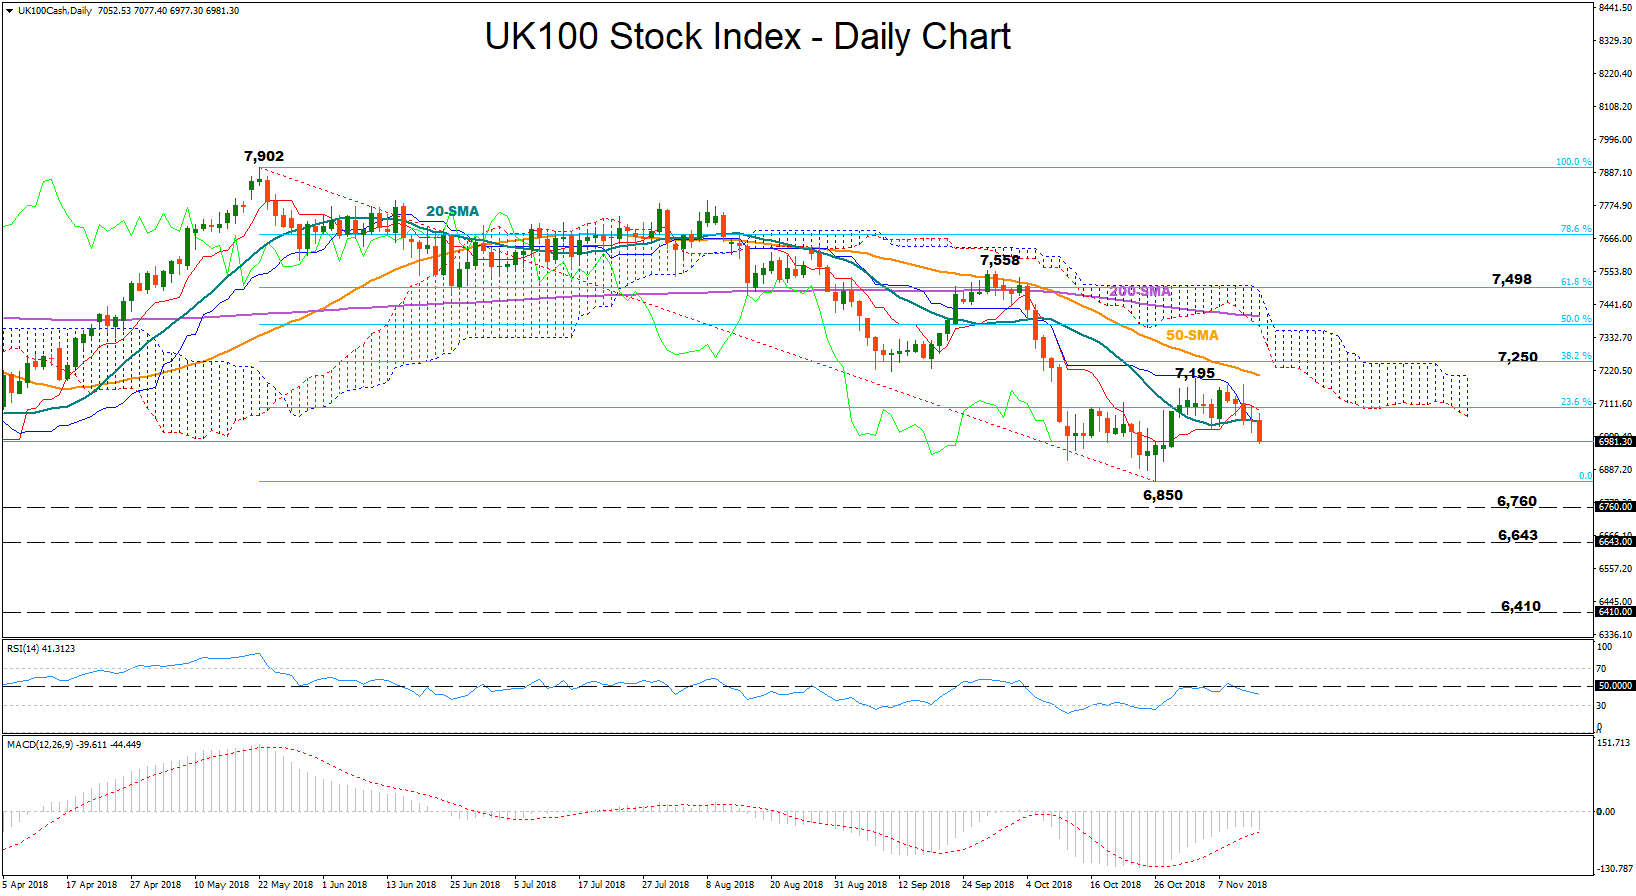
UK100 stock index (FTSE 100) has rebounded somewhat after falling to an 8-month low of 6,850 on October 26 but momentum indicators now suggest that the market sentiment might get worse before getting better as the RSI is reversing back to the downside after failing to break decisively above its 50-neutral threshold. The MACD also looks to be changing direction, moving down to meet its red signal line in negative zone.
Should bearish dynamics dominate, the market might revisit the 6,850 bottom before meeting the 6,760 low on March 25. Below that, the area around 6,643 which halted downside corrections several times between August-December 2016 could be another potential barrier in focus, while steeper declines may overcome that point to test 6,410, a frequently approached level in 2016 and 2015.
Alternatively, if the price manages to rebound above 7,095, the 23.6% Fibonacci of the downleg from 7,902 to 6,850, nearby resistance could come from the previous peak at 7,195. Further up, the index could rest around the 38.2% Fibonacci of 7,250 as it did in early September, while a violation of this point may shift attention towards the 7,498-7,558 region, formed by the 61.8% Fibonacci and the top on September 27. A decisive close above the latter and hence above the Ichimoku cloud would increase speculation that an uptrend is in progress.
In the medium-term picture, the downfall from 7,902 is still active and hence the outlook remains negative. The 50-day moving average has further increased distance below the 200-day MA, hinting that the downward pattern might hold for longer.
To summarize, UK100 stock index bias looks negative both in the short and the medium term.


