
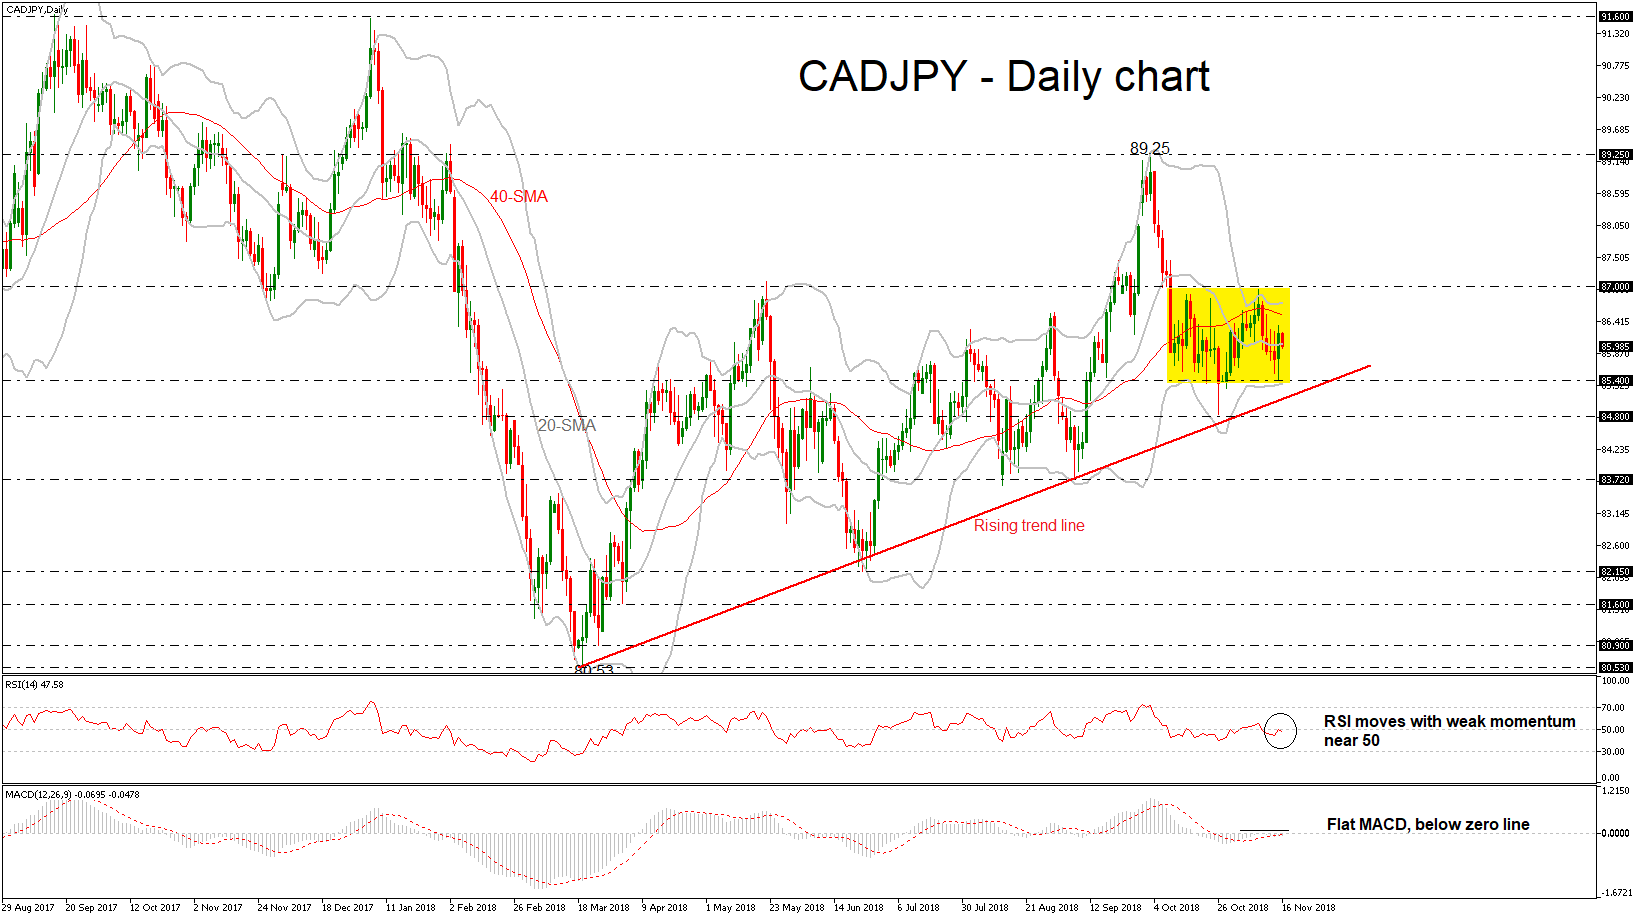
CADJPY is back in bullish mode in the daily timeframe over the last eight months that helped the market to head higher and peak at 89.25 on October 3. While the MACD suggests that the market could maintain the neutral movement near the zero line and the RSI moves slightly below the 50 level, as the price has failed to provide strong direction during the past month. Moreover, the Bollinger Band is squeezing indicating sideways movement.
Should the price head lower, traders could look for support around 85.40, which stands near the long-term ascending trend line. Even lower, a break below this line could shift the bullish outlook to a more bearish one and touch the 84.80 support. A substantial close below this low would clearly re-challenge the 83.72 region.
On the other side, gains could try to overcome the 40-day simple moving average (SMA) and the upper Bollinger Band could reach the 87.00 handle. Further up, the attention would turn to the area around 89.25, a frequently approached zone on October 3.
In the long-term view, the bullish outlook remains intact as CADJPY remains above the rising trend line, despite the latest sideways move in the near term.


