
Gold has reversed back up again after finding support at the short-term ascending trend line during the preceding week. The price reached a one-week high of 1225 on Friday before falling back below 1220.
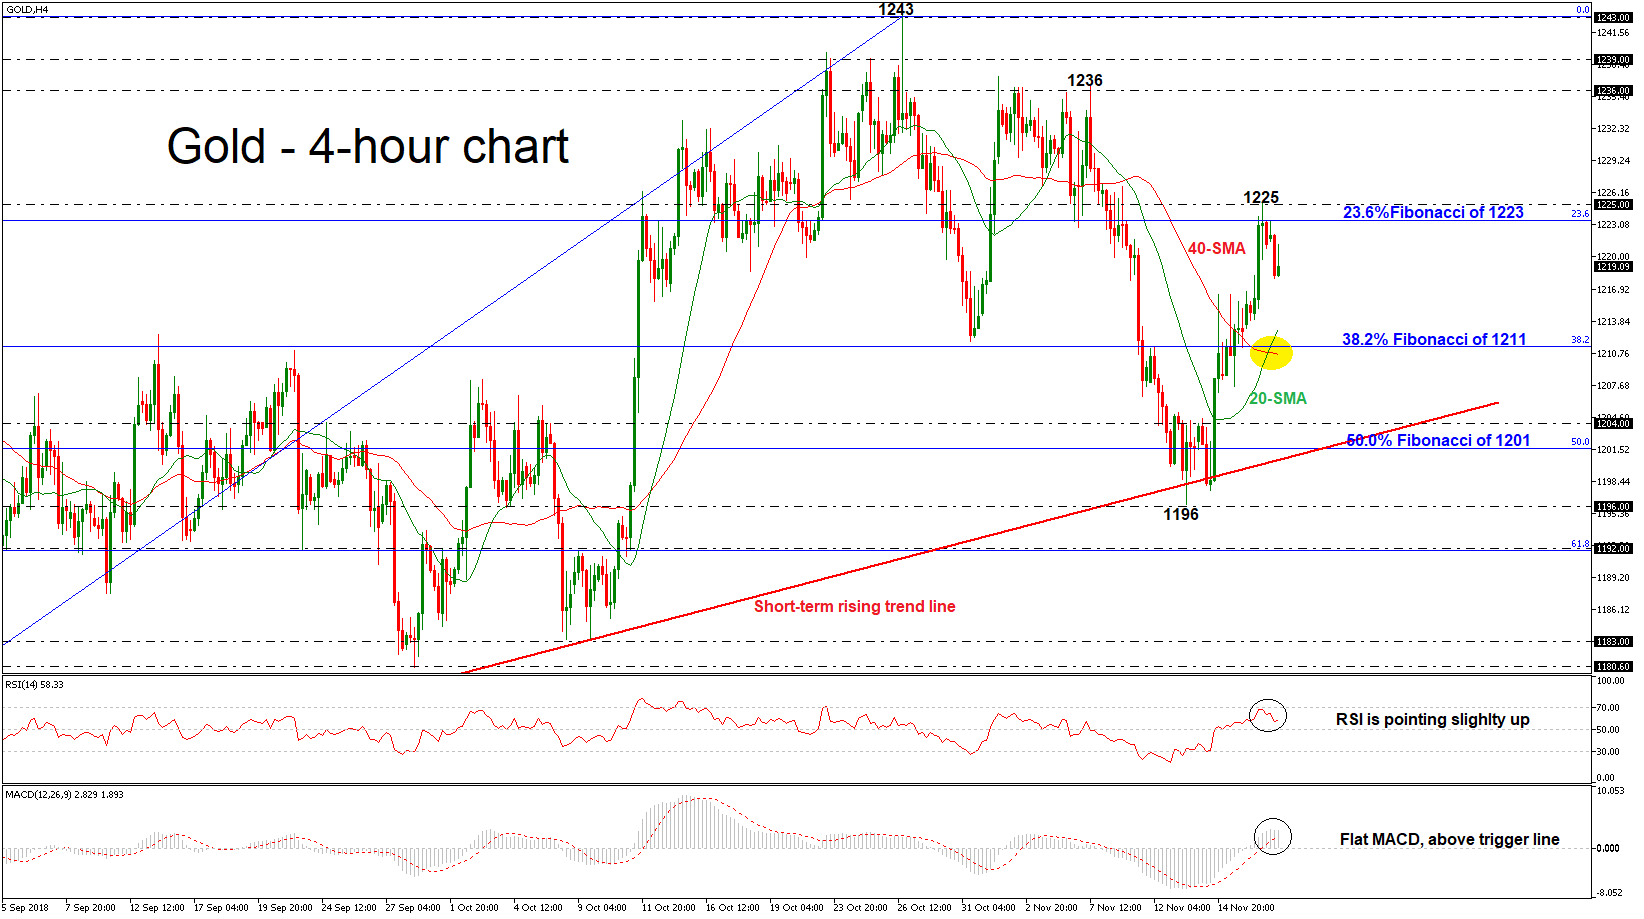
The momentum indicators lost their strong positive momentum in the 4-hour chart. The RSI indicator remains in bullish territory and is pointing slightly up, while the MACD oscillator is flattening above the trigger and zero lines. Moreover, the yellow metal remains well above the bullish crossover of the 20- and 40-simple moving averages (SMAs) in the near term.
Upside moves are likely to find resistance between the 23.6% Fibonacci retracement level of the upleg from 1160 to 1243 around 1223 and the 1225 resistance level. Rising above this area would help shift the focus to the upside towards the 1236 barrier, taken from the peaks at the beginning of November.
In case of bearish pressures, the price could hit the 20-SMA near 1213 before touching the 38.2% Fibonacci mark of 1211. Even lower, the yellow metal could re-test the 1204 support, which stands slightly above the 50.0% Fibonacci of 1201 and the rising trend line.
In the bigger picture, gold prices remain above the rising trend line, which has been holding since August 16.


 Is Testing an Important Resistance Zone")


