
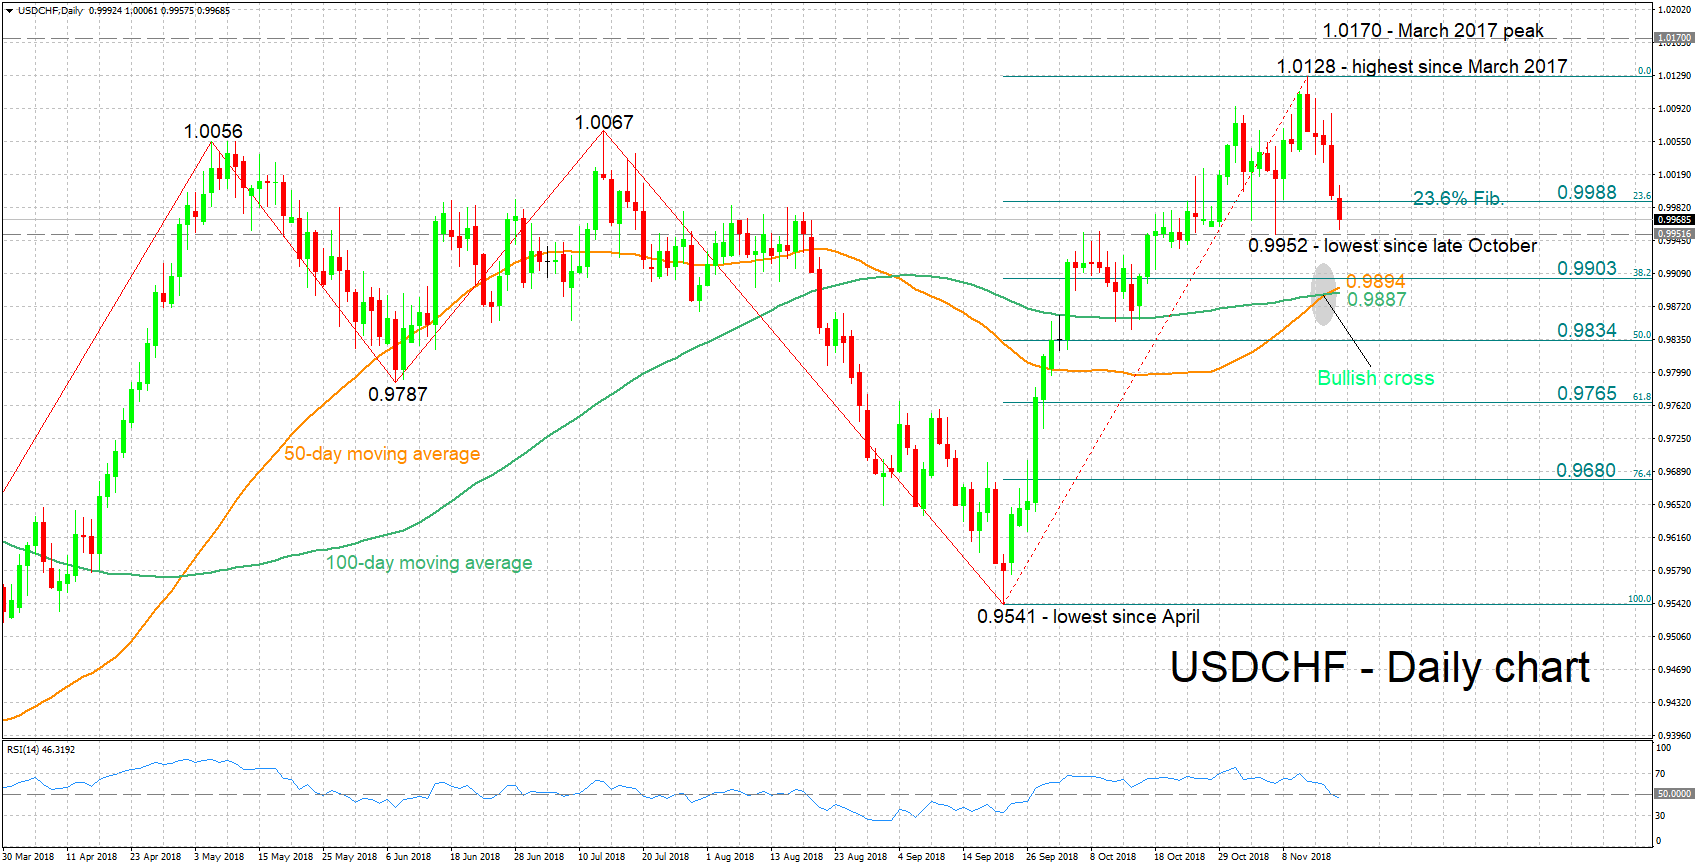
USDCHF recorded considerable losses after touching its highest since March 2017 of 1.0128 last Tuesday. Additionally, the pair hit a near two-week low of 0.9958 earlier on Monday and looks set to record its fifth straight day of declines.
The short-term momentum turned to the downside as evidenced by the downward sloping RSI which entered bearish territory below 50.
Immediate support to declines may be coming around 0.9952, the pair’s lowest since late October. Notice that the area around this was congested between mid-June and late August. Further below, support could emerge around 0.9903, the 38.2% Fibonacci retracement level of the upleg from 0.9541 to 1.0128; the current levels of the 50- and 100-day moving average lines at 0.9894 and 0.9887 correspondingly are also part of the zone around this Fibonacci point. Even lower, the 50% Fibonacci mark at 0.9834 would be eyed.
On the upside, resistance could take place around the 23.6% Fibonacci mark of 0.9988, with the region around it also capturing the parity level (1.00) that may hold psychological importance. The focus would turn to the 1.0056 and 1.0067 peaks in the event of more bullish movement, while higher still, Tuesday’s top of 1.0128 would again come within scope.
Despite the recent decline, the medium-term outlook continues to look mostly positive, with trading activity taking place above both the 50- and 100-day moving average lines. It is also of note that the two MAs have recently posted a bullish cross.
To conclude, the short-term momentum looks negative at the moment, while the medium-term picture continues to look predominantly bullish.


