
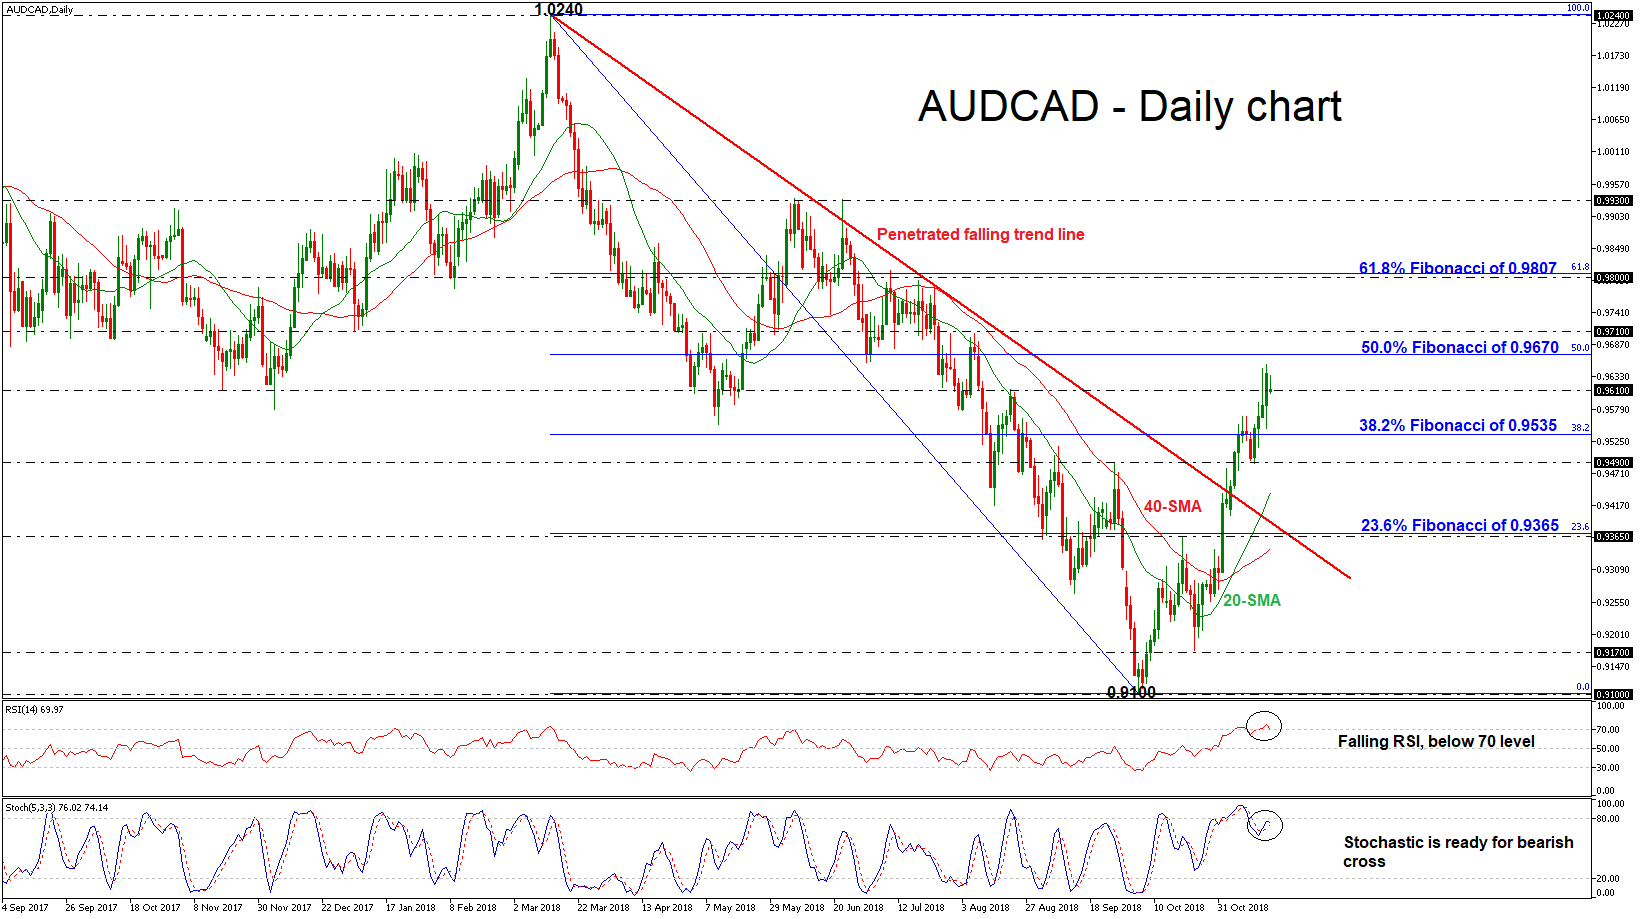
AUDCAD turned positive after its bullish rally above the descending trend line, which has been holding since March 14, recording a three-month high of 0.9653. In the short-term, the technical indicators are signaling for overstretched movement as they point down. The RSI indicator is trying to slip below its overbought territory, while the %K line of the stochastic oscillator is ready for a bearish cross with the %D line.
On the downside, the area between the 38.2% Fibonacci retracement level of the downleg from 1.0240 to 0.9100, near 0.9535 and the 0.9490 support barrier could provide immediate support as it did the past week. Beyond this area, support could then run towards the 20-day simple moving average near 0.9440 at the time of writing before challenging the 23.6% Fibonacci region of 0.9365.
Should the price head north, it would be interesting to see whether the upside run could stop, probably around the 50.0% Fibonacci of 0.9670. If this is not the case, the market could jump above this level in order to meet the 0.9710 resistance. Even higher, the area between the 0.9800 handle and the 61.8% Fibonacci a few pips higher could be another target for investors.
To sum up, AUDCAD successfully surpassed the medium-term downtrend line, shifting the outlook to a more positive one.


