
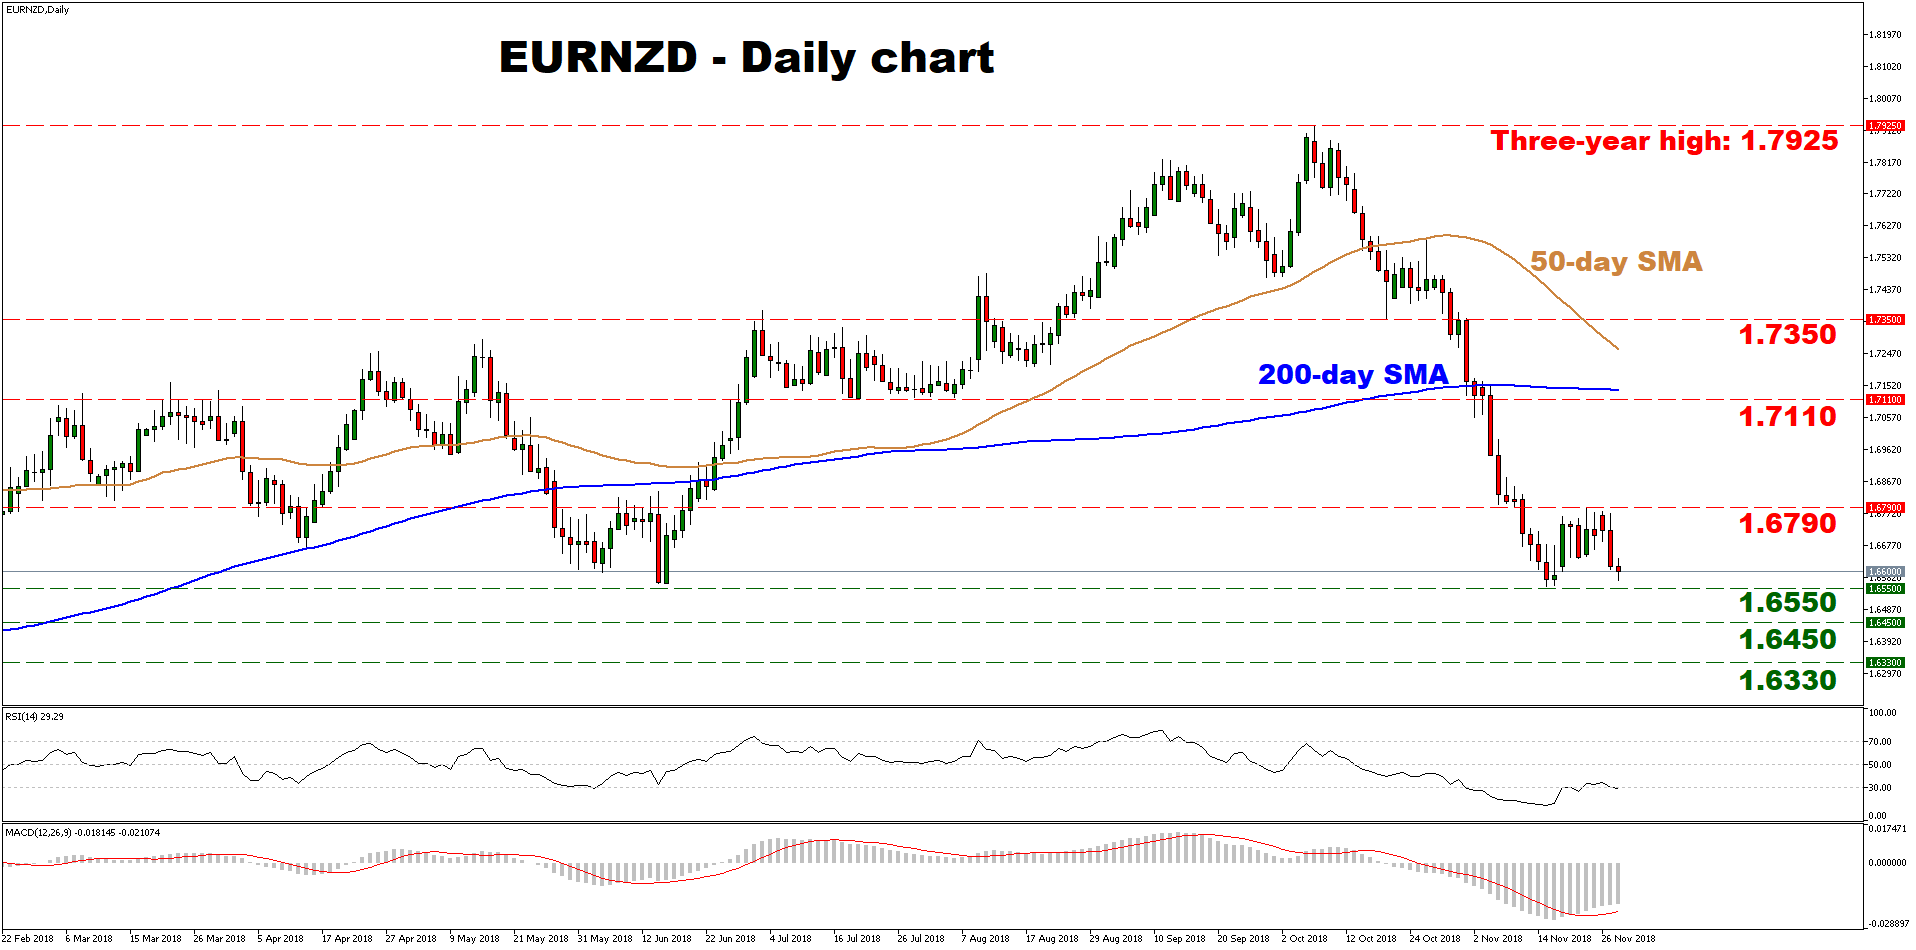
EURNZD plunged after touching a three-year high of 1.7925 in early October, crossing below its 50- and 200-day simple moving averages (SMAs) to briefly touch 1.6550 – a low last seen in January. A decisive move below 1.6550 would mark a lower low on the daily chart, signaling a resumption of the downtrend.
Short-term oscillators support the bleak picture. The RSI detects accelerating downside momentum, though the fact it just fell below its oversold 30 level implies a short-term rebound shouldn’t be ruled out. Meanwhile, the MACD may soon test its red trigger line; a crossing below it would be a negative signal.
Further declines may meet preliminary support near 1.6550, which was tested on November 11. If the bears pierce below it, the next obstacle may be the 1.6450 zone, marked by the inside swing high on September 25, 2017. Even lower, the October 17, 2017 low at 1.6330 could attract attention.
On the flipside, a rebound may stall at 1.6790, the November 22 top. An upside break could open the way for 1.7110, an area that acted as support in July and August, with the zone around it encapsulating the 200-day SMA at 1.7138. Higher still, the bulls may aim for the October 19 trough of 1.7350, assuming they pierce the 50-day SMA at 1.7260 first.
Summarizing, the overall picture seems negative, and a clear close below 1.6550 would reaffirm that.


