
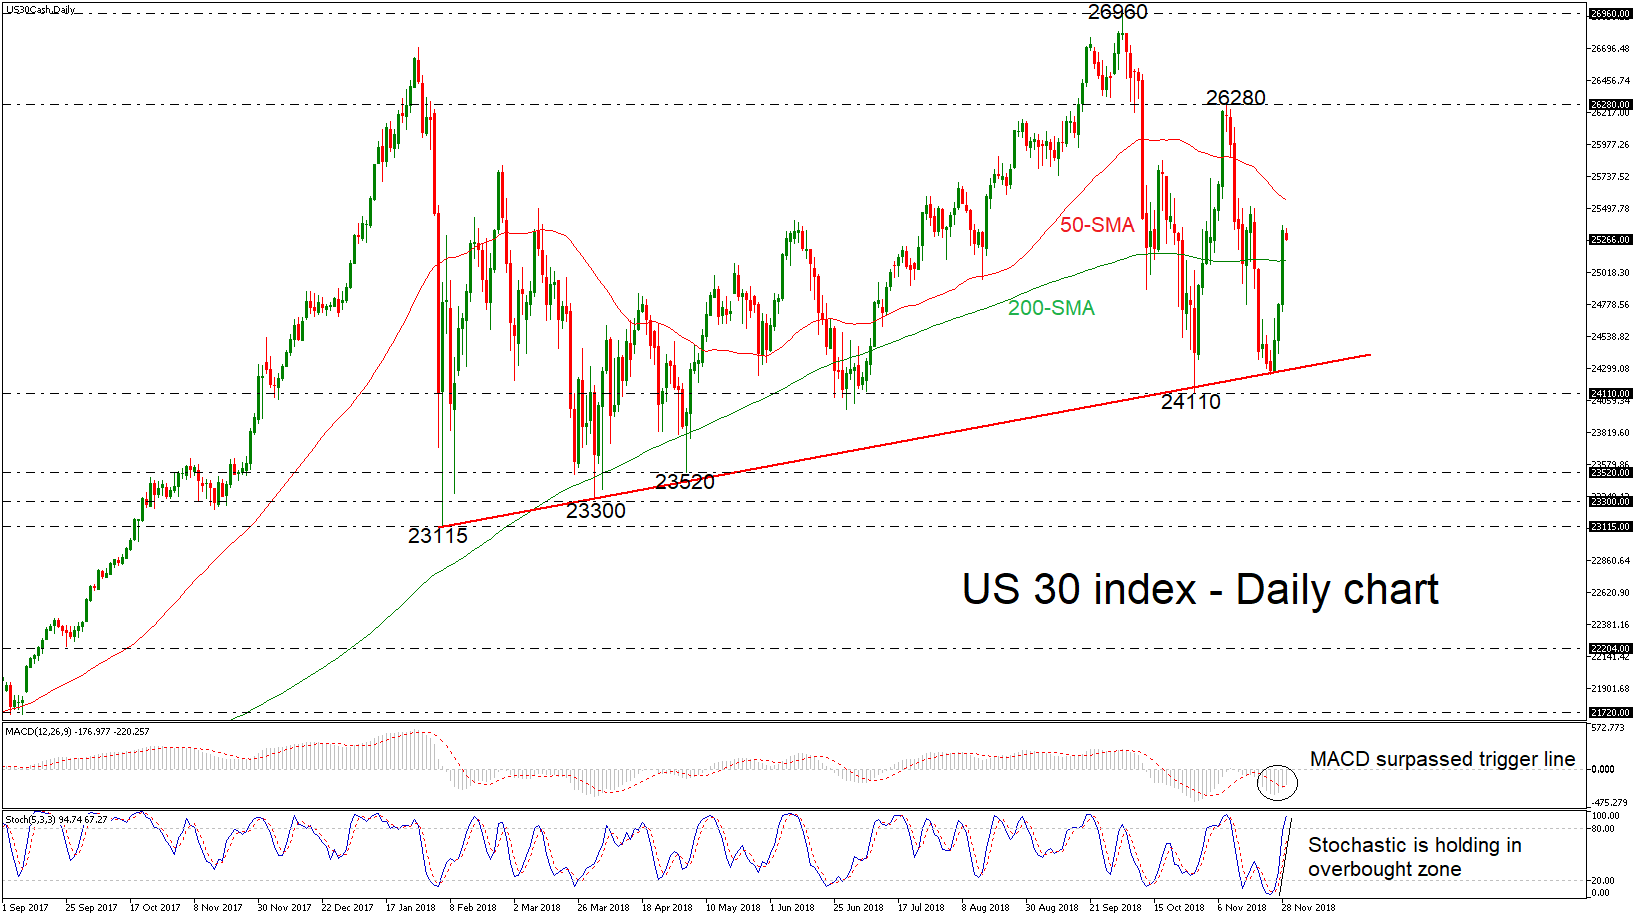
The US 30 index has been heading sharply higher over the previous three days, finding strong support on the rising trend line. The price successfully surpassed the 200-simple moving average (SMA) in the daily timeframe and the momentum indicators are endorsing the bullish view. The MACD oscillator turned higher above its signal line, while the %K line of the stochastic oscillator stands in the overbought zone.
Should the price continue to head north, the 50-day SMA is the next obstacle to look for around 25,557. A jump above these lines would bring the focus to the 26,280 resistance, taken from the peak on November 8.
Alternatively, it would be interesting to see whether the rising trend line can stop the bearish movements again. If this is not the case, the market could slip until the next barrier at the 24,110 support, which stands marginally below the diagonal line. Even lower, the 23,520 could act as a major support as well, confirming the scenario for more losses, identified by the trough on May 3.
Broadly, the index has been following an upward move and only a daily close below the rising trend line could increase the chances for a bearish tendency.


