
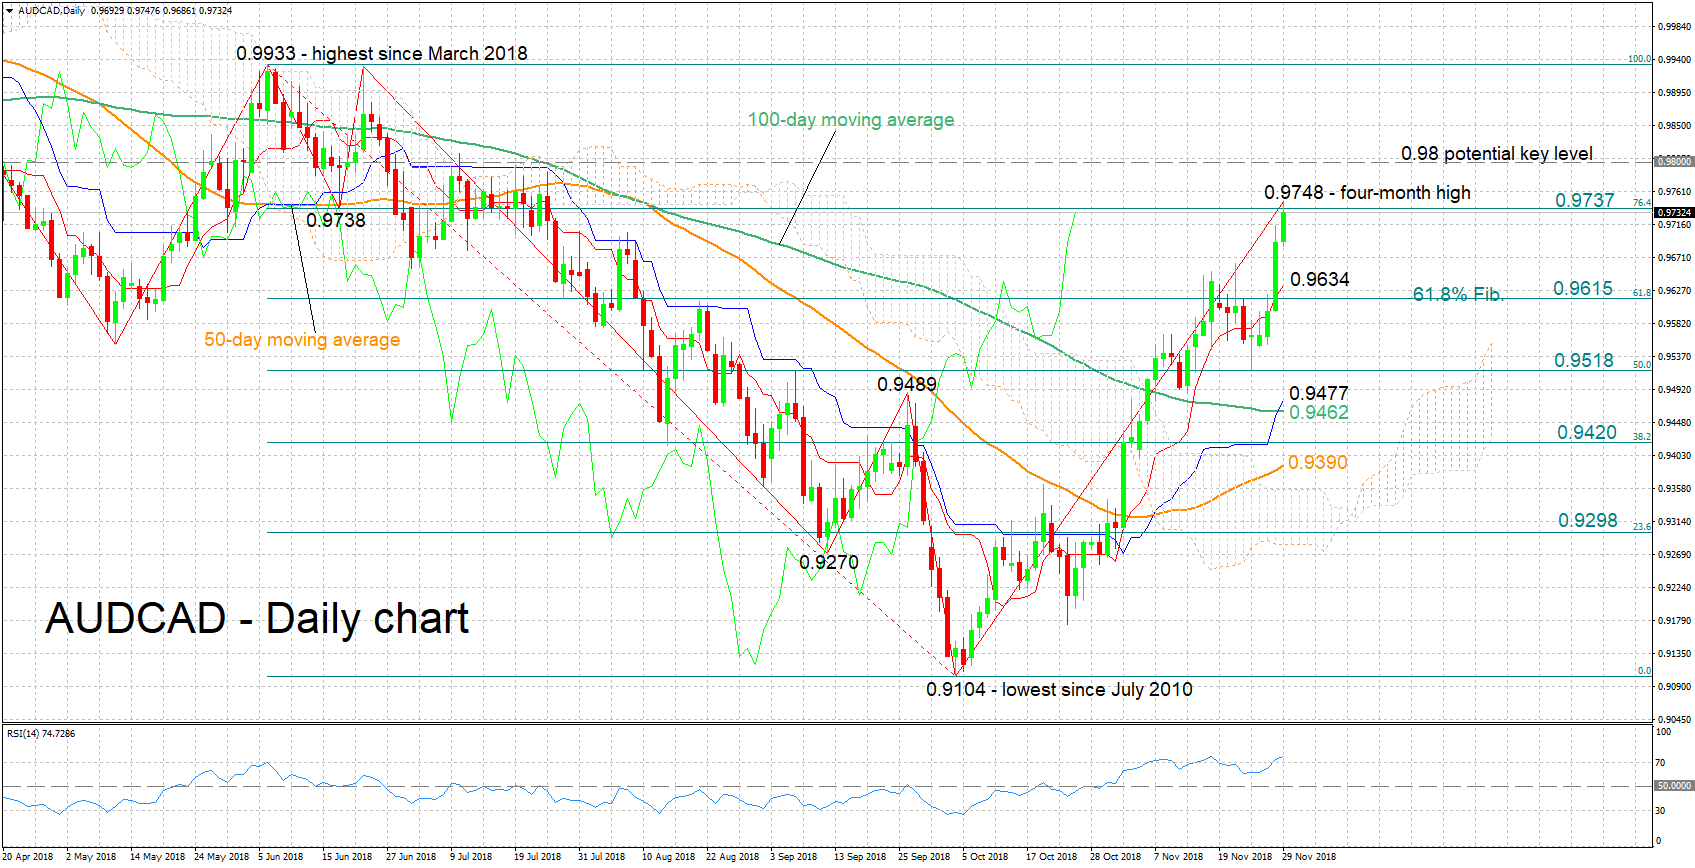
AUDCAD staged a strong rebound after falling to 0.9104 in early October, this being its lowest since July 2010. Earlier on Thursday, it touched a four-month high of 0.9748.
The positively aligned Tenkan and Kijun-sen lines, as well as the rising RSI, are attesting to the bullish short-term bias that is in place. The RSI has entered overbought territory though. This implies that the late rally may be overstretched, which in turn translates into increased odds for a near-term pullback.
The area around 0.9737, which was momentarily broken earlier in the day, may be acting as a first line of resistance to further gains; the aforementioned point is the 76.4% Fibonacci retracement level of the downleg from 0.9933 to 0.9104. Higher, a barrier could come around the 0.98 handle, with the region around it being somewhat congested earlier in the year. Higher still, the 0.9933 peak would increasingly come into scope.
On the downside, support could come around 0.9615, the 61.8% Fibonacci mark; the zone around this level also captures the current level of the Tenkan-sen at 0.9634. Steeper losses would increasingly eye the 50% Fibonacci at 0.9518.
In terms of the medium-term picture, the move above 0.9489, which violated the downtrend condition of lower highs and lower lows that was previously in place, has definitively shifted the outlook towards a more bullish direction. Another bullish medium-term signal is that trading activity is taking place above the 50- and 100-day moving average lines, as well as above the Ichimoku cloud.
To conclude, the short-term outlook is bullish, though there are signs of an overextended advance. Meanwhile, the medium-term picture has assumed a bullish tilt in recent weeks.


