
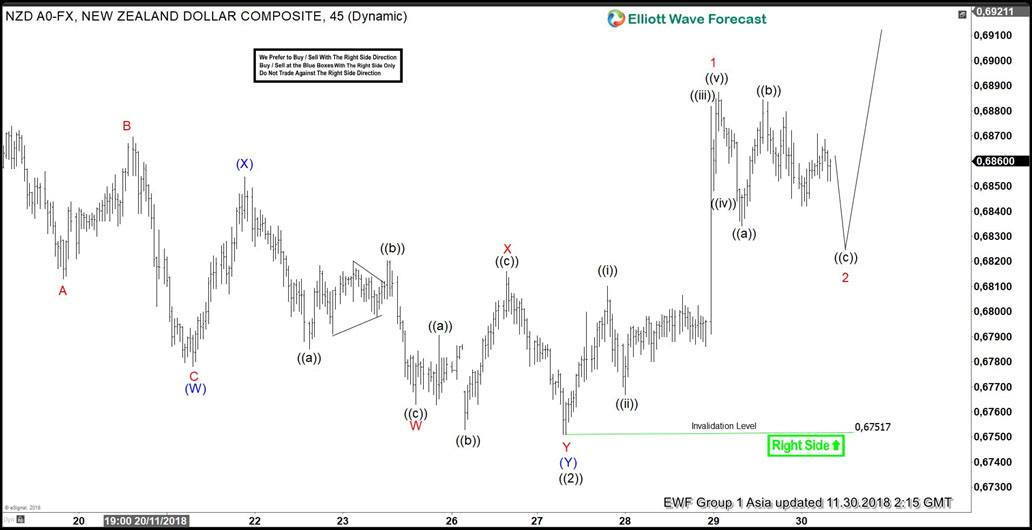
NZDUSD short-term Elliott wave analysis suggests that a decline to 0.6751 low ended primary wave ((2)) pullback. The internals of that pullback unfolded as double three structure where intermediate wave (W) ended at 0.6780 low in lesser degree zigzag structure. Up from there, a 3 wave bounce to 0.6852 high ended intermediate wave (X). Then finally a decline to 0.6751 low ended intermediate wave (Y) in lesser degree double three structure & finally completed primary wave ((2)).
Up from 0.6751 low, the pair has made a new high above 11/16/2018 peak favoring a next leg higher within primary wave ((3)). Thus suggests supported to higher NZDUSD looking for more upside. Above from 0.6751 low, the initial rally to 0.6809 high ended Minute wave ((i)). Minute wave ((ii)) ended at 0.6770 low, Minute wave ((iii)) ended at 0.6879 & Minute wave ((iv)) ended at 0.6851 low. Minute wave ((v)) ended at 0.6885 high which also completed Minor wave 1.
Down from there, Minor wave 2 pullback remain in progress to correct the rally from 0.6751 low in 3, 7 or 11 swings before further upside renew. Short-term focus remains towards 0.6833-0.6803 100%-161.8% Fibonacci extension area of a Minute wave ((a))-((b)) to end first 3 swings from the peak & find buyers there for 3 wave bounce at least. We don’t like selling it and expect buyers to appear in 3, 7 or 11 swings against 0.6751 low.
NZDUSD 1 Hour Elliott Wave Chart


