
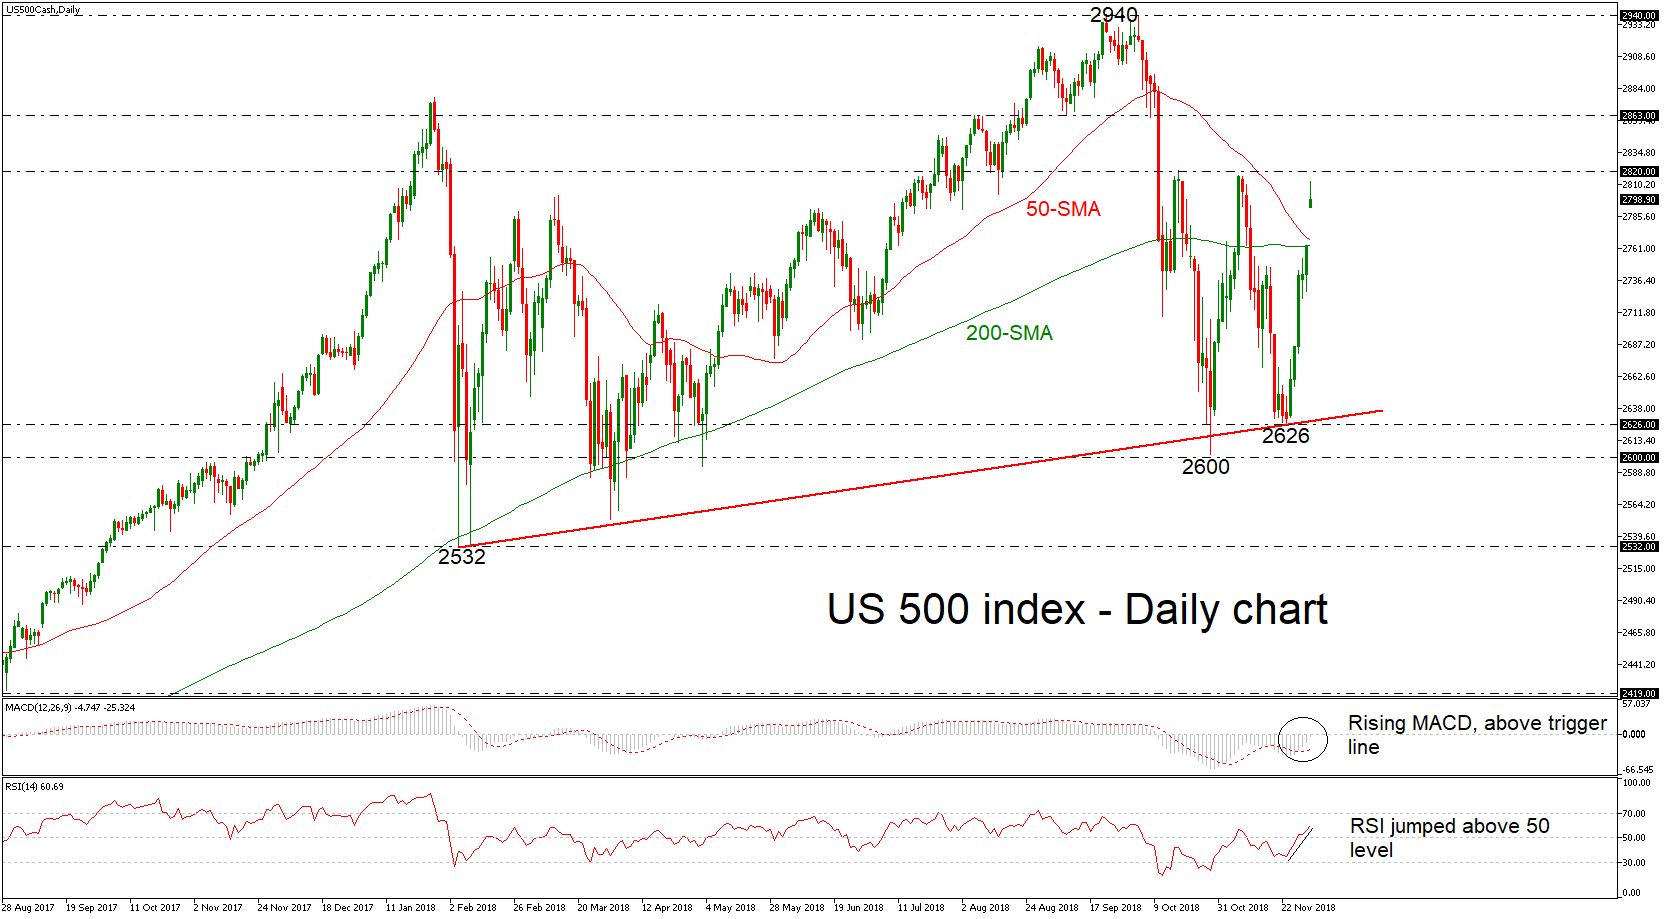
The US 500 index opened higher today as it posted a positive gap, surpassing the 50- and 200-simple moving averages in the daily chart. The index is set to complete the sixth green day in a row after the rebound on the long-term ascending trend line.
Short-term oscillators support the bullish move. The RSI is standing above the neutral threshold of 50 and pointing higher, detecting accelerating positive momentum. The MACD, is still below zero line but is strengthening its movement to the upside.
Further upside pressures could drive the price towards the immediate resistance of 2820, identified by the latest highs. A break above this level could move the market towards the next resistance area of the 2863 barrier, taken from the inside swing bottom on September 7. The all-time high of 2940 could be a level for traders to look for.
On the flipside, a downside retracement could meet resistance at the moving averages, which stand around 2765. A downside break may open the way for the 2626 zone, the November 22 trough, before the October 29 bottom of 2600 comes into view.
Overall, both the short-term and long-term pictures appear positive at the moment.


