
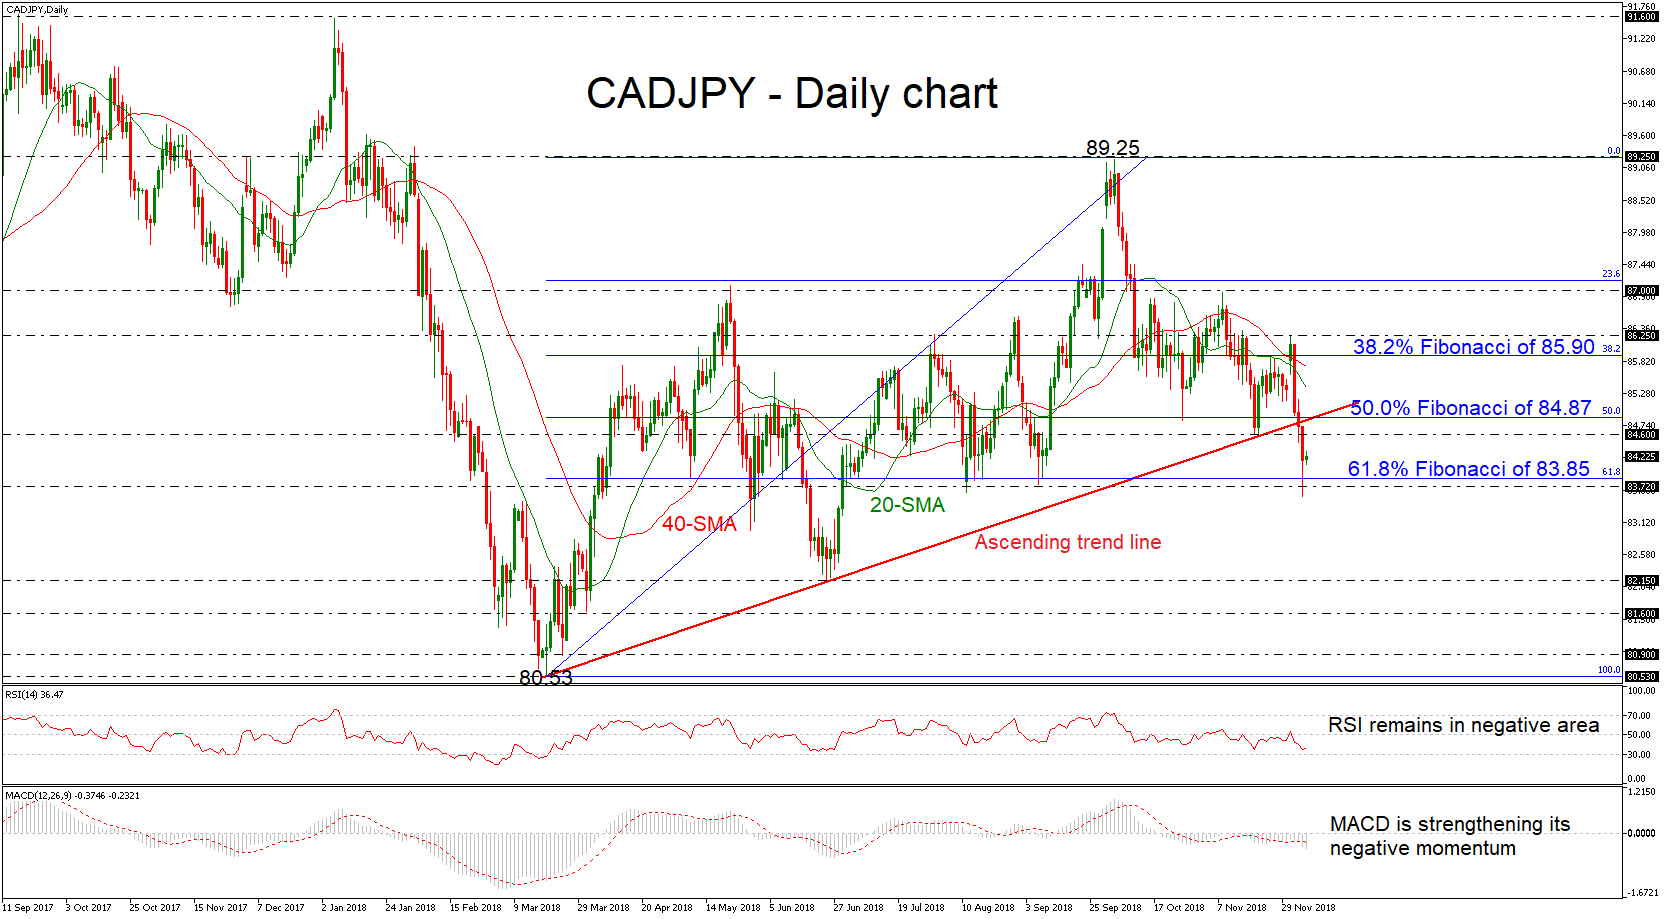
CADJPY completed a five-month low of 83.55 on Thursday and had a significant bearish rally in the preceding three days. The strong bearish sentiment has pushed the price to penetrate the long-term ascending trend line to the downside, shifting the positive outlook to a more negative one.
Despite the latest pullback on price today, the technical indicators remain in the bearish territory. The MACD oscillator is strengthening its momentum below the trigger line, while the RSI indicator is flattening.
Should the pair manage to strengthen its negative momentum, the next support could come around the 61.8% Fibonacci retracement level of the upleg from 80.53 to 89.25, around the 83.72 barrier. This hurdle acted as strong support level in the previous three months, however, if the price tumbles below it, this would open the way for a downside rally towards the 82.15 level.
If prices are unable to hold below the diagonal line, the risk would shift back to the upside with the 84.60 resistance and the 50.0% Fibonacci mark of 84.87 coming into focus. A jump above the 50.0% Fibonacci would signal a resumption of the longer-term uptrend and send prices until the 38.2% Fibonacci of 85.90.
In the bigger view, the outlook has switched to neutral since prices hold below all the moving average lines and the rising trend line, which has been holding since March 19. A significant close below 83.72 would confirm the bearish bias.


