
Nikkei short-term Elliott wave view suggests that the cycle from 10/01/2018 peak is showing 5 swings bearish sequence. This favor more downside to 19073-16773 100%-123.6% Fibonacci extension area to be reached in 7 swings before support for bigger 3 wave bounce is seen at least. The decline from 10/01 peak is showing overlapping price action thus suggests that decline is unfolding in a corrective sequence i.e could be unfolding as double three structure.
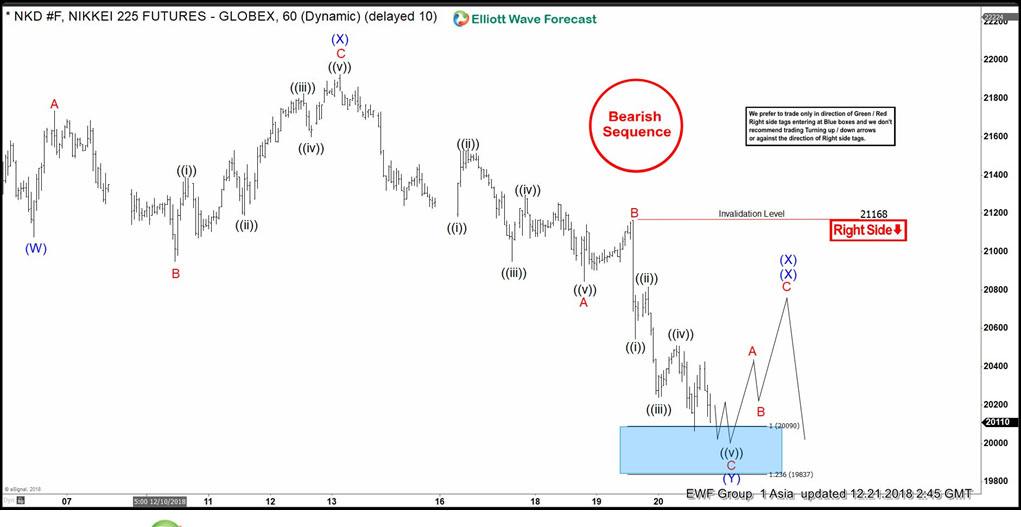
Currently, the decline to 21075 low intermediate wave (W) lower. Above from there, a bounce in intermediate wave (X) took place as a Flat correction where Minor wave A ended at 21735 high. Minor wave B ended at 20950low and Minor wave C ended at 21890 high which also completed intermediate wave (X). Down from there, intermediate wave (Y) remains in progress in a lesser degree zigzag structure where Minor wave A ended in 5 waves at 20845 low. Then a 3 wave bounce to 21168 high ended Minor wave B.
Below from there, Minor wave C remains in progress in another lesser degree 5 waves structure & reached the 100%-123.6% Fibonacci extension area of Minor wave A-B to complete intermediate wave (Y) soon. Afterward, the index is expected to do a bounce in 3, 7 or 11 swings within intermediate (X)(X) of a possible triple correction lower as per aggressive view against 21168 high pivot firstly & against 21890 high in the second degree. We expect short-term sellers to appear in 3, 7 or 11 swings on a bounce in intermediate wave (X)(X).
Nikkei 1 Hour Elliott Wave Chart


