
Elliott Wave view in Alibaba (BABA) shows that the stock has an incomplete bearish sequence from 6.5.2018 high ($211.7). The 100% target in 7 swing comes at $88.3 and this view remains valid as far as the stock stays below 12.3.2018 high ($168.8). Near term, decline from 12.3.2018 high ended with Cycle degree wave w at $129.10.
Internal of Cycle degree wave w unfolded as a zigzag Elliott Wave structure where Primary wave ((A)) ended at $150.5, Primary wave ((B)) ended at $158.05, and Primary wave ((C)) ended at $129.10. The stock is currently correcting cycle from 12.3.2018 high within Cycle degree wave y in 7 or 11 swing before the decline resumes.
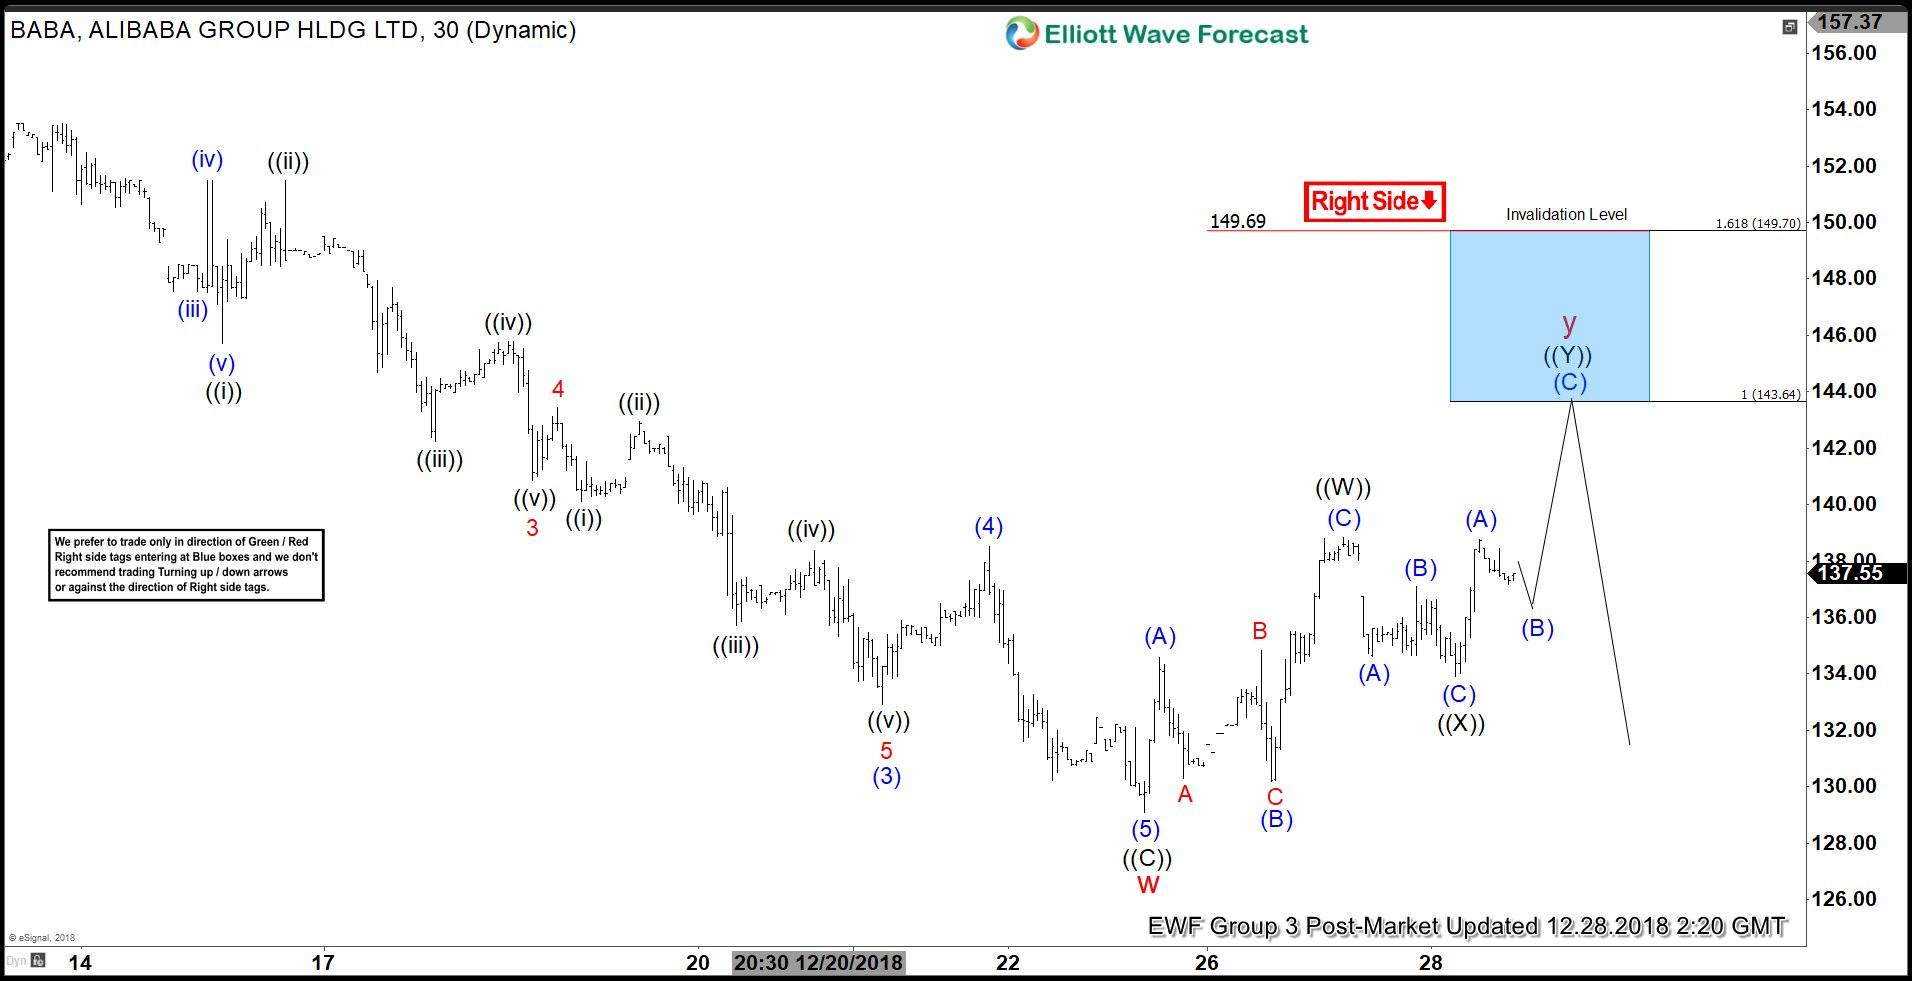
Internal of wave y is unfolding as a double three Elliott Wave structure where Primary wave ((W)) ended at $138.84, Primary wave ((X)) ended at $133.89, and Primary wave ((Y)) of y aims for $143.64 – $149.7 target before the decline resumes. We expect sellers to appear from this blue box $143.64 – $149.7 area for more downside or 3 waves pullback at least.
Alibaba 1 Hour Post-Market Elliott Wave Chart


 Pullback to Find Support")


