
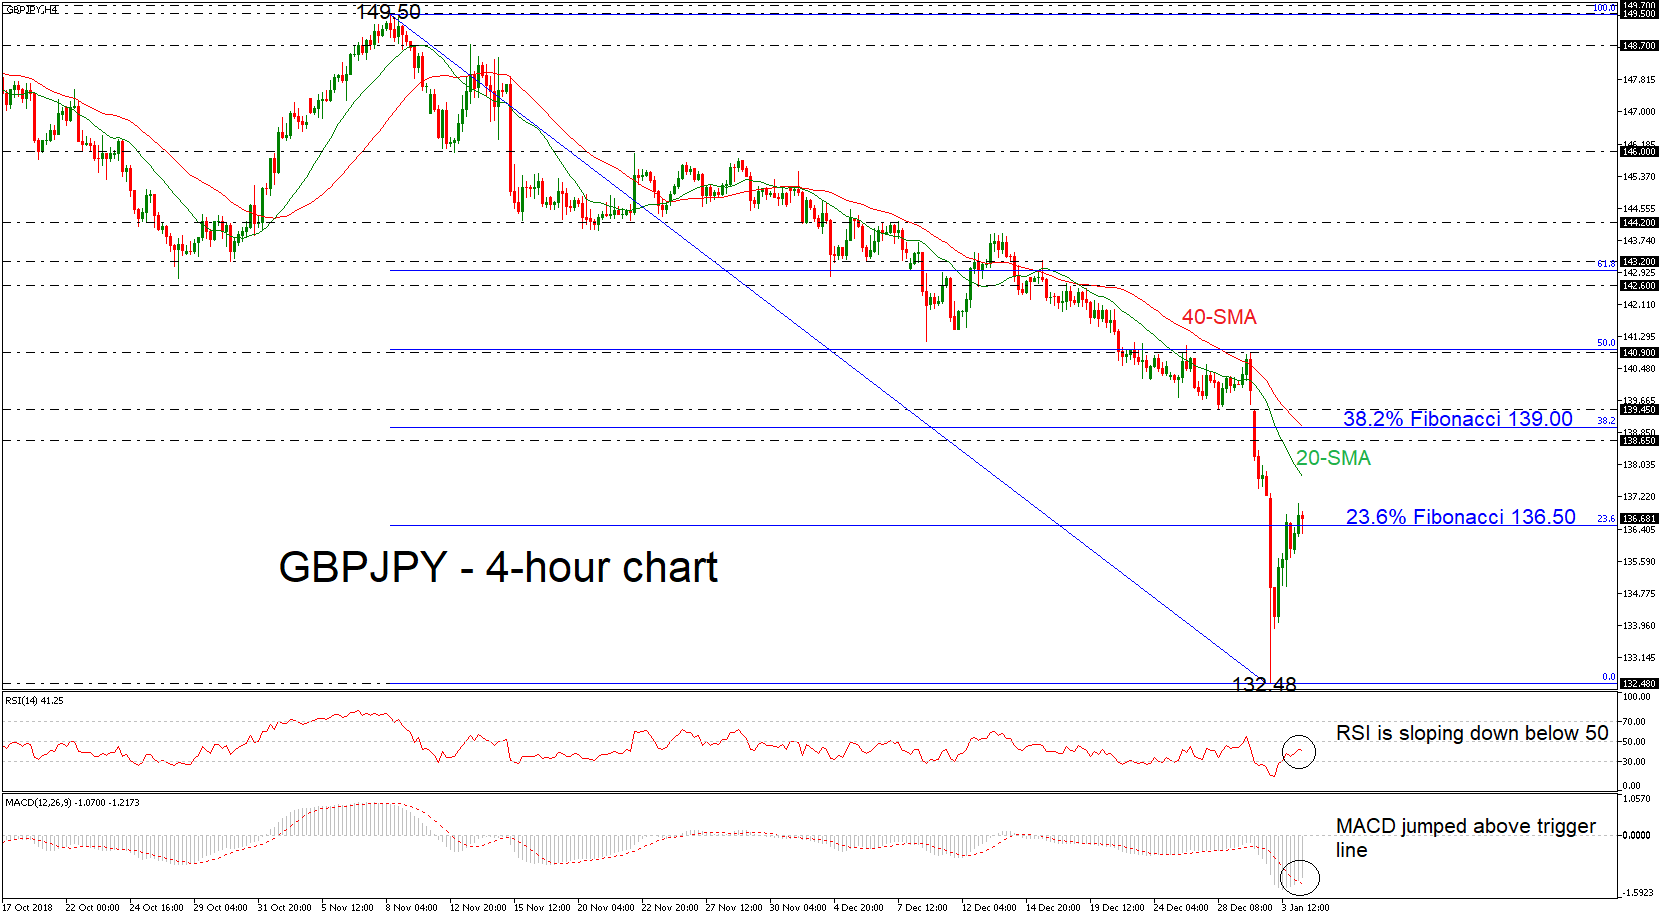
GBPJPY is seeing a pause in the selling pressure after reaching a more than two-year low around 132.48 on Thursday, with the MACD hinting a continuation of the rebound, fluctuating above trigger line in the 4-hour chart. However, the RSI indicator is sloping down in the negative territory, despite the latest upside pullback in the market.
Further bullish actions above the 23.6% Fibonacci retracement level of the downleg from 149.50 to 132.48, near 136.50, could find immediate resistance at the 20-simple moving average (SMA) around 137.70. Higher, the pair could touch the 138.65 resistance, while a climb above this barrier could hit the 38.2% Fibonacci, which overlaps with the 40-SMA of 139.00 at the time of writing.
Alternatively, should the price break the floor around the 23.6% Fibonacci, support could appear at 132.48. If the latter proves a weak obstacle, then the next stop for investors to have in mind is the 129.00 psychological level, taken from the highs on December 2016.
Overall, GBPJPY is still in a downward movement but upside risks are rising in the very short-term.


