
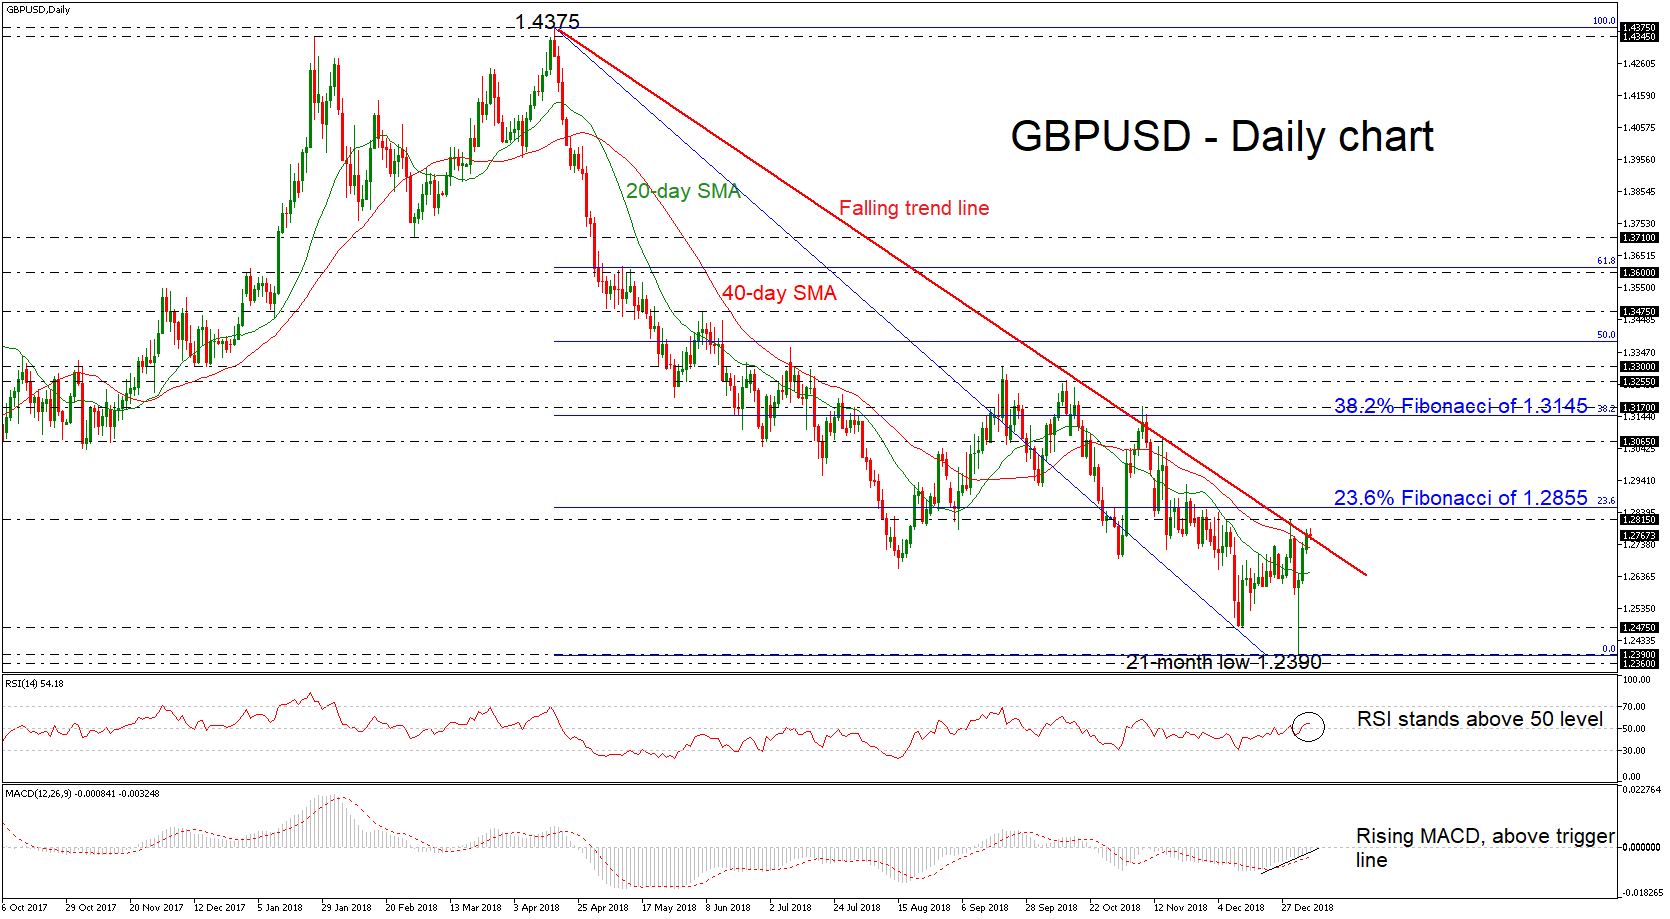
GBPUSD has been edging higher over the last three days, following the bounce off the 21-month low of 1.2390 that was reached on January 2. This week the pair continues to attract buying interest, with the price climbing slightly above the long-term descending trend line.
The technical indicators are still positive in the short-term, with the MACD stretching further above its red trigger line and the RSI moving above the 50 level with weak momentum. Yet the latter could also be an indication that the upside rally is overdone, and hence negative movements should not be a surprise in coming sessions.
If traders turn their attention to higher levels, the 1.2815 and the 23.6% Fibonacci retracement level of the downleg from 1.4375 to 1.2390 of 1.2855 would be the next level to focus on. If bullish actions appear even stronger, the market could find resistance at the 1.3065 barrier, identified by the minor high on November 14.
In the alternative scenario, if the price drops back below the falling trend line, it could touch again the 40- and then the 20-simple moving averages (SMAs) at 1.2725 and 1.2650 respectively in the daily timeframe. Moving lower, a violation of these levels would increase downside pressure, challenging the 1.2475 support obstacle, taken from the low on December 12.
To sum up, the short-term risk looks to be turning positive, while in the long-term view, the downfall from 1.4375 is still active and hence the outlook remains negative.


