
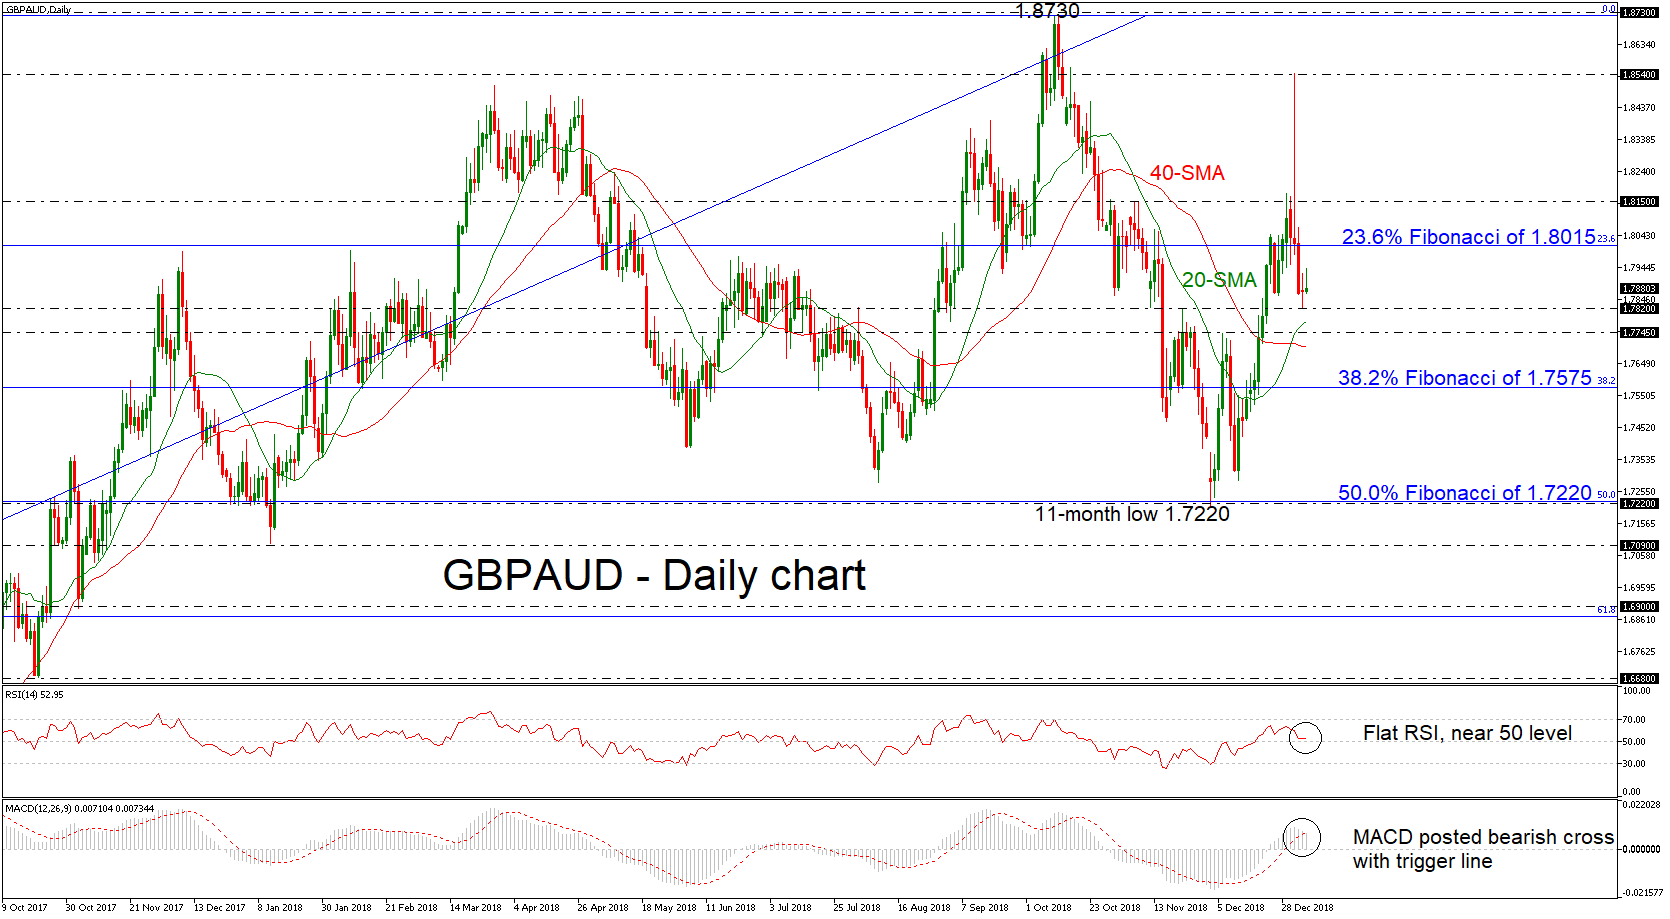
GBPAUD moved aggressively lower from the 1.8540 resistance level, slipping beneath the 23.6% Fibonacci retracement level of the upleg from 1.5725 to 1.8730, around 1.8015. The technical structure is not looking very positive at the moment with the RSI developing near the neutral level of 50, while the MACD oscillator posted a bearish crossover with its red trigger line in the short-term. Despite that, the 20- and 40-simple moving averages (SMAs) created bullish cross in the preceding week, confirming the longer-term upside tendency.
In case of a downward movement the market could stop near the 1.7820 support and then at the 1.7745 barrier. The aforementioned areas encapsulate the 20-SMA around 1.7780. Even lower, support could be found at the 38.2% Fibonacci of 1.7575.
If the price manages to edge higher and rise above the 23.6% Fibonacci mark of 1.8015, this could send the price until the 1.8150 resistance, taken from the highs on November 6. An upside penetration of this barrier could drive the market towards the 1.8540 resistance, registered on January 3.
To conclude, GBPAUD has been trading within an upside rally since October 2016, creating higher highs and higher lows during this period.


