
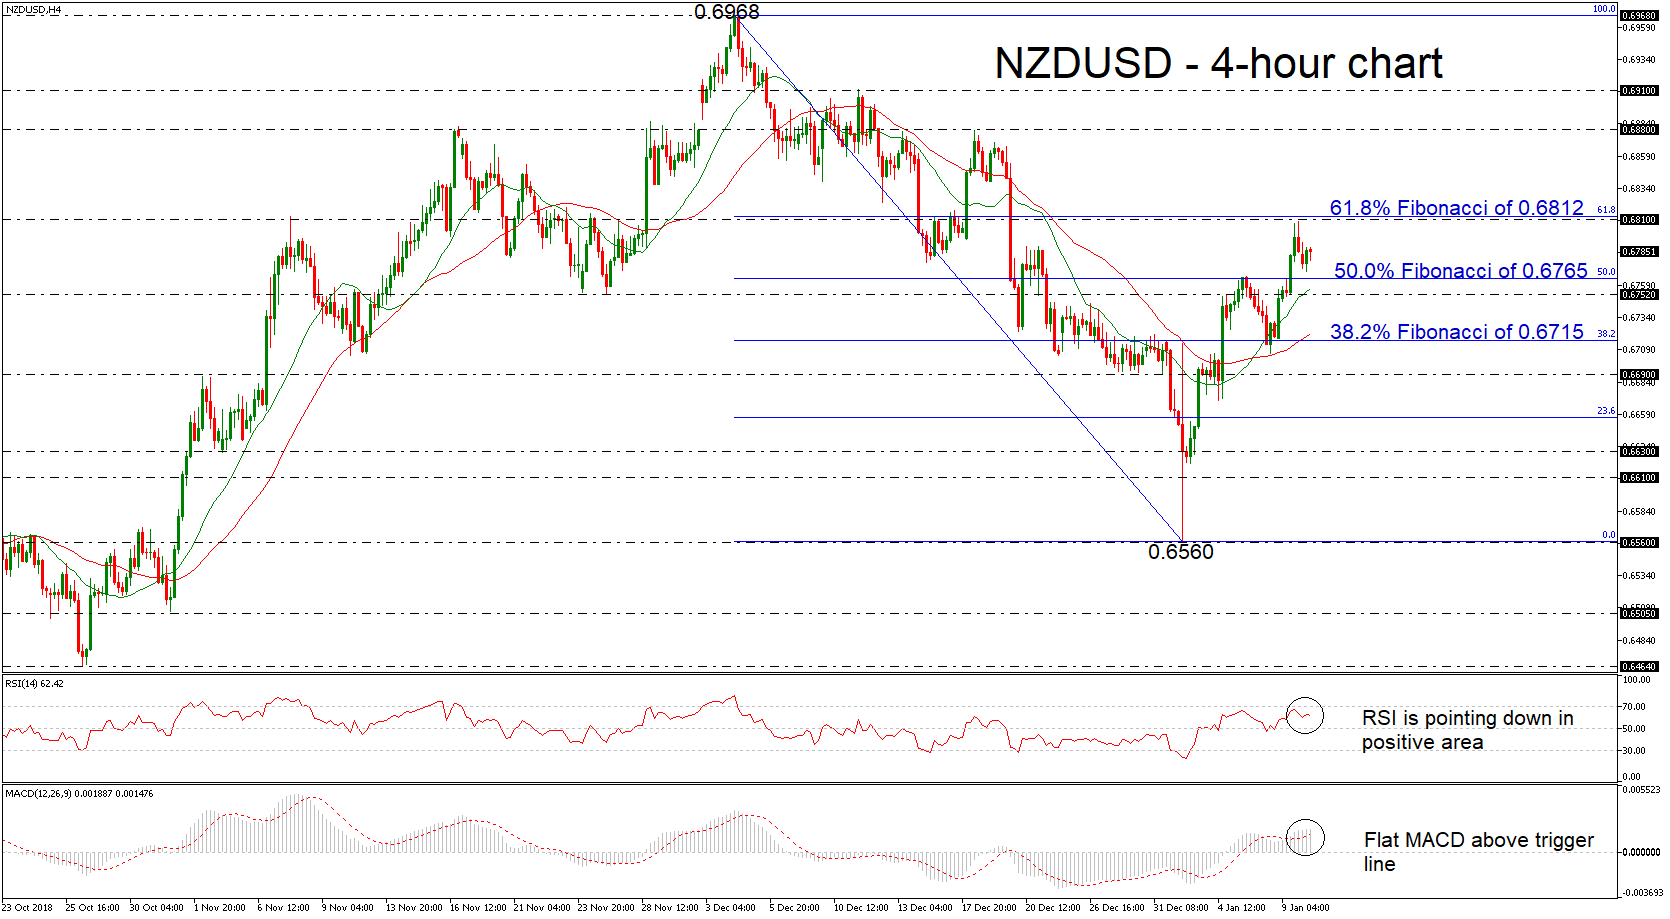
NZDUSD has recovered substantially after the selling interest from the 0.6968 barrier, almost hitting the 61.8% Fibonacci retracement level from 0.6968 to 0.6560, around 0.6812. Currently, the price is trading well above the 20- and 40-simple moving averages (SMAs) in the 4-hour chart. However, the technical indicators are suggesting flat to bearish movement as the RSI is sloping down in the positive zone and the MACD is moving sideways above the trigger line.
A move to the upside could see immediate resistance at the 61.8% Fibonacci level of 0.6812. Should the market increase positive momentum above this area, the 0.6880 could be next the level for investors to focus on. A stronger barrier, though, could be found at the 0.6910 barrier, registered on December 11.
Should the pair face more negative pressures, the market could meet support at the 50.0% Fibonacci of 0.6765, which stands slightly above the 0.6752 hurdle and the 20-SMA. A successful close below this level could see a retest of the 38.2% Fibonacci of 0.6715.
To sum up, NZDUSD has been trading higher in the very short-term following the rebound on the 0.6560 support.


