
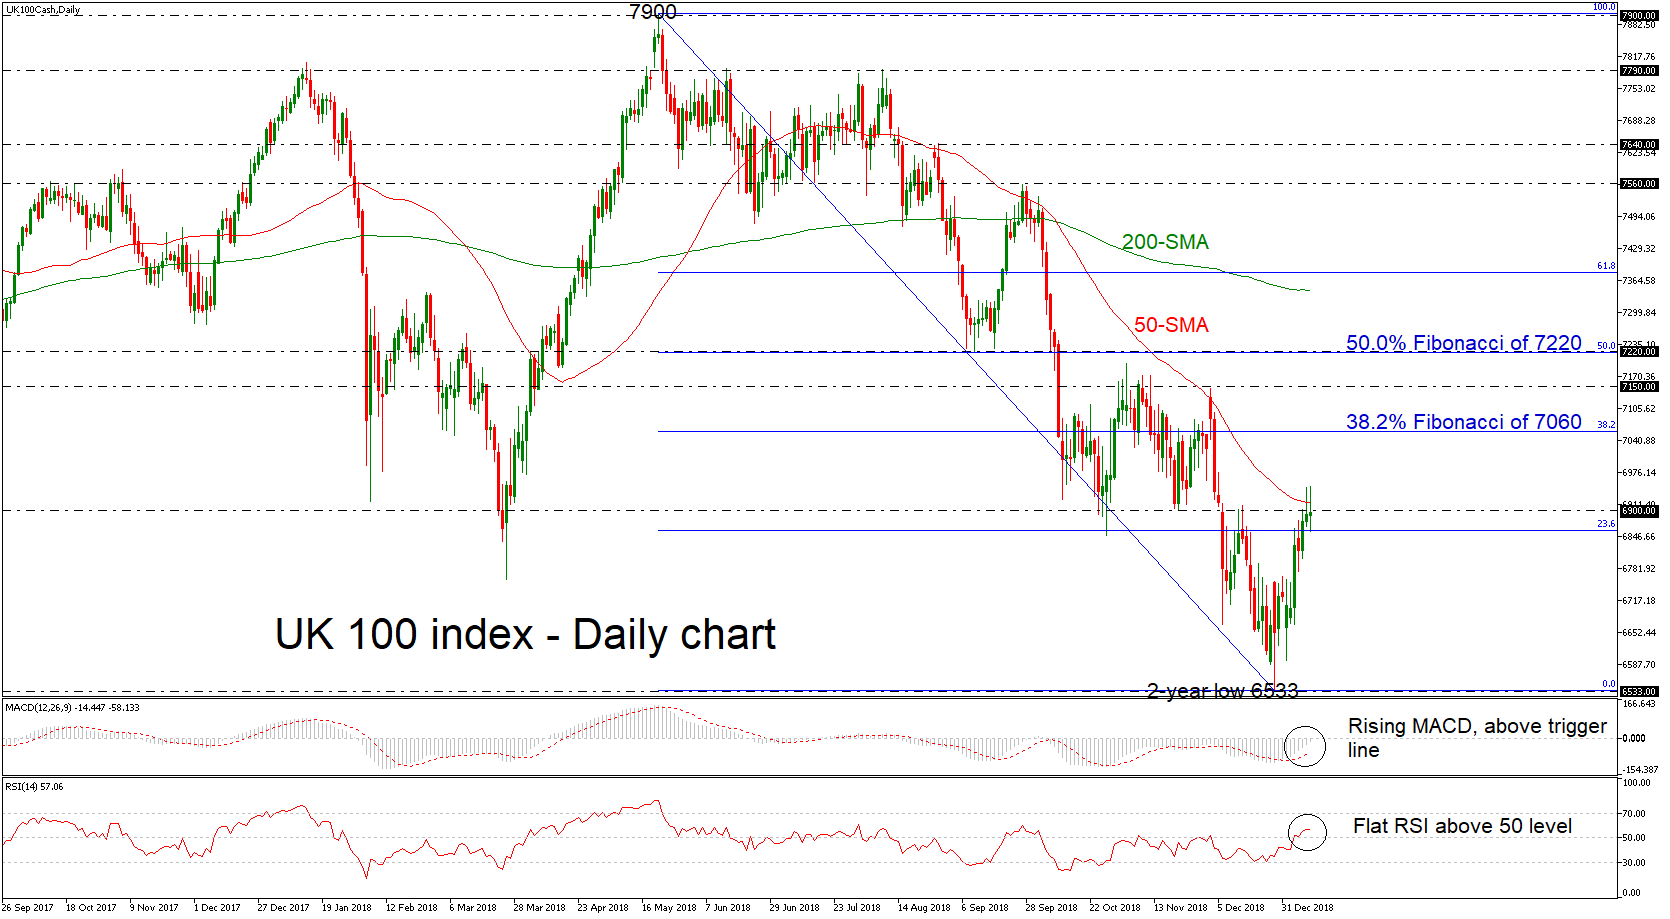
UK 100 stock index (FTSE 100) has rebounded somewhat after falling to a two-year low of 6533 on December 27, hitting the 50-day simple moving average (SMA). Momentum indicators now suggest that the market sentiment might get better as the RSI is moving in the positive territory. The MACD also looks to be changing direction, moving higher to meet its zero line in the negative zone.
If the price manages to continue bullish actions and surpass 6900, the 38.2% Fibonacci retracement level of the downleg from 7900 to 6533, around 7060 could come in focus. Further up, the index could rest around the 7150 level as it did in early December, while a violation of this point may shift attention towards the 7200 resistance, which overlaps with the 50.0% Fibonacci mark.
However, should bearish dynamics dominate, the market might revisit the two-year trough of 6533. Below that, the area around 6440, identified by the low on April 2016, could be another potential barrier for traders.
Overall, the downfall from 7900 is still active and hence the outlook remains negative despite the two consecutive green weeks. The 50-day simple moving average (SMA) has further increased distance below the 200-day SMA, hinting that the downward pattern might hold for longer.


