
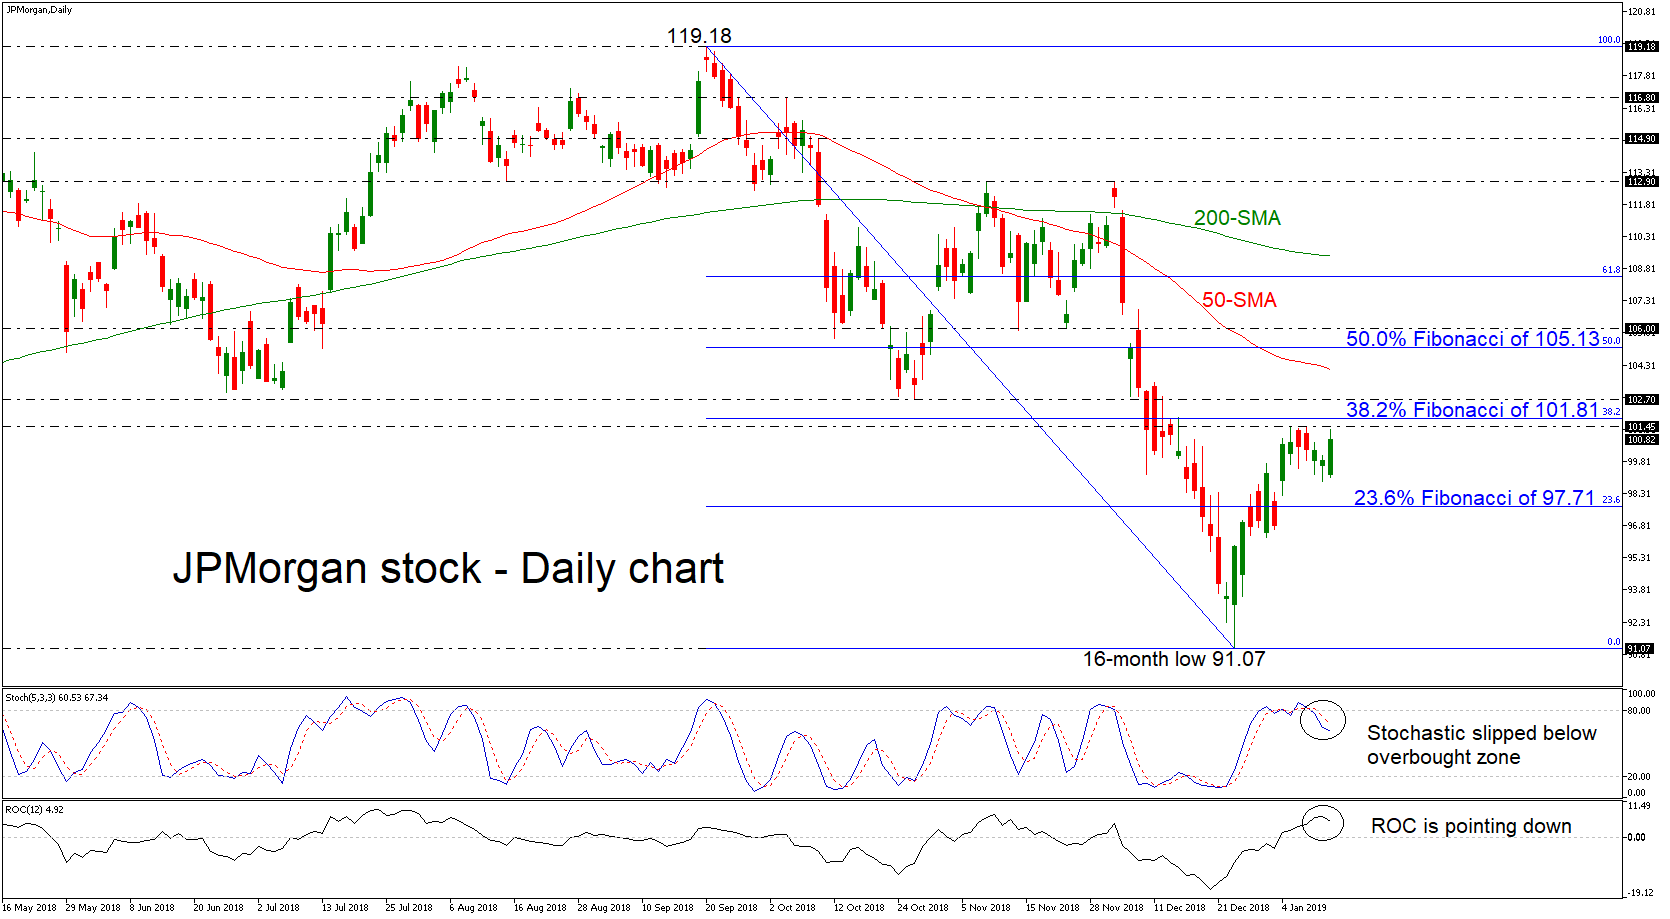
The JPMorgan stock price is continuing last month’s rebound on the 16-month low of 91.07, touching the 101.45 resistance level. However, looking at the technical indicators, they suggest bearish actions as the price opened with a gap down in the previous sessions. The stochastic oscillator is moving lower below the overbought level, while the ROC is pointing down above the zero line.
The 38.2% Fibonacci retracement level of the downleg from 119.18 to 91.07, around 101.81 could be a trigger point for steeper bullish actions. Further upside pressures could attract greater attention around the 102.70 resistance level before touching the 50-day simple moving average (SMA), near 104.06. Also, more buyers could be waiting to enter the market once the price hits the 50.0% Fibonacci of 105.13.
However, if the stock reverses back to the downside, investors could stop at the 23.6% Fibonacci region of 97.71. If the price continues to drop, support could next come somewhere around the 16-month low of 91.07.
In the medium-term picture, the bounce back has failed to turn the outlook from negative to bullish as the stock needs to climb above the 61.8% Fibonacci 108.45 for stronger advances.


