
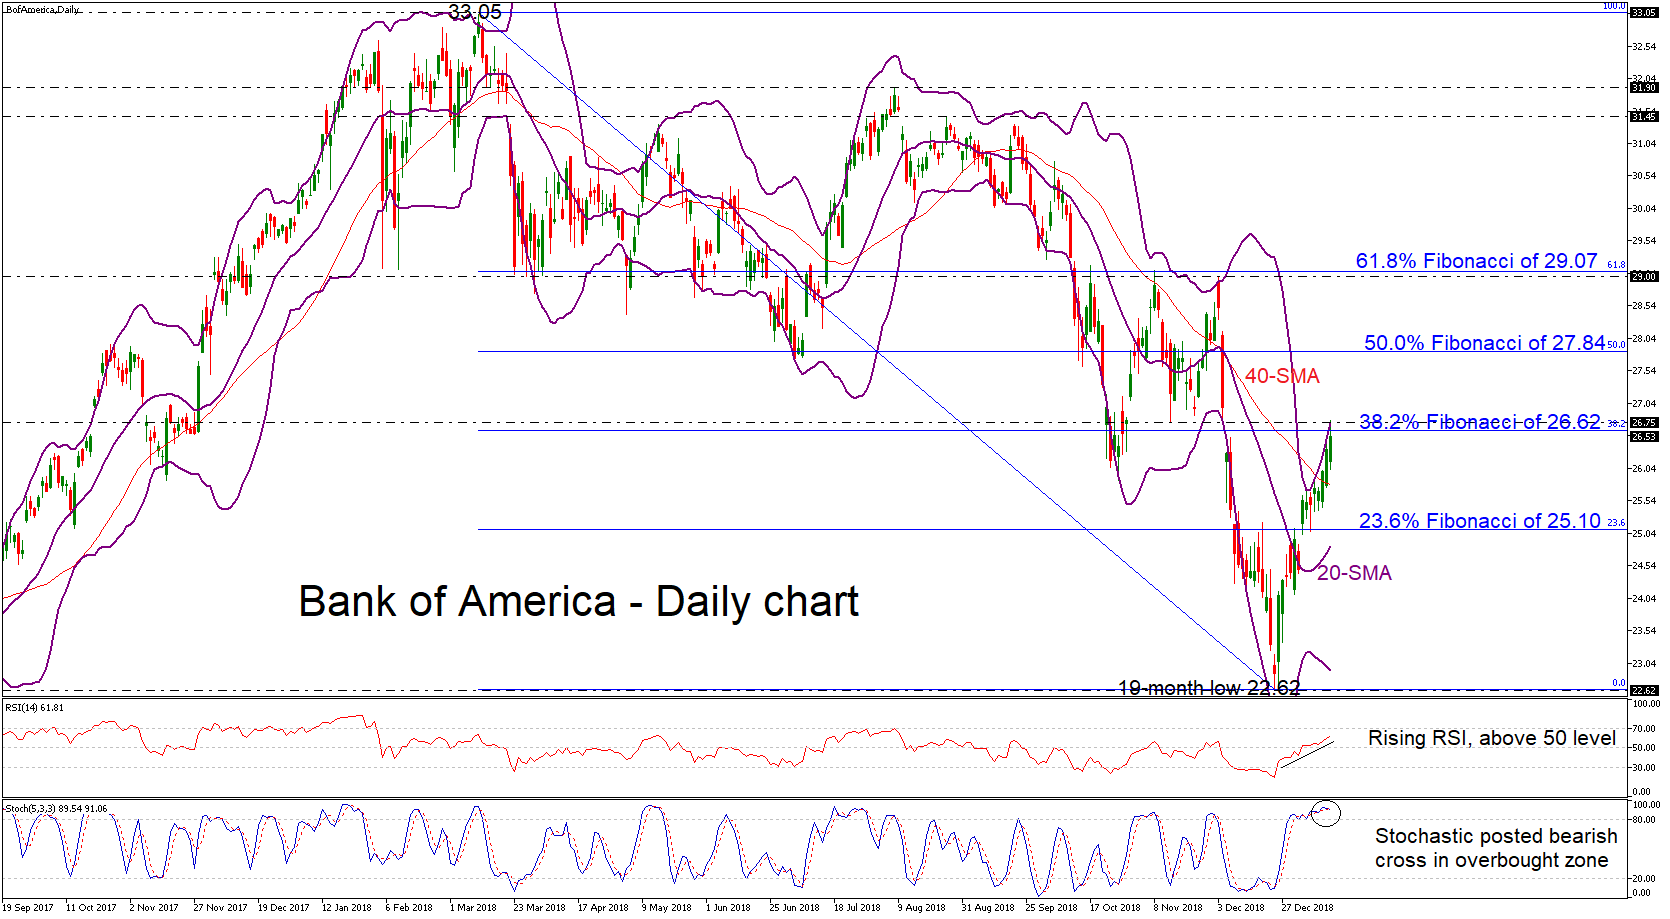
Bank of America stock price has had one of the best trading sessions over the last three consecutive weeks, following the pullback on the 19-month trough of 22.62. The price touched the 26.75, a one-month high, and the upper Bollinger Band in Tuesday’s trading period.
The technical indicators are still located in bullish area in the daily chart, with the RSI stretching further above its neutral threshold of 50 while the stochastic oscillator posted a bearish crossover within its %K and %D lines. Yet the latter could also be an indication that the rally is overdone, and hence negative corrections should not be a surprise in coming sessions.
Traders would be eagerly looking for a break above yesterday’s top of 26.75 to increase buying orders. The next stop to have in mind is the 50.0% Fibonacci retracement level of the downleg from 33.05 to 22.62 around 27.84. If bullish forces appear stronger, the 61.8% Fibonacci around the 29.00 psychological level could be the next target to look for.
In the alternative scenario, should the price retreat, the 40-day simple moving average (SMA) near 25.78 could be the first pause before heading towards the 23.6% Fibonacci of 25.10. Even lower, the price could slip until the mid-level of the Bollinger Band of 24.84 at the time of writing.
In the longer timeframe, the downfall from 33.05 is still active and hence the outlook remains negative despite the latest upward movement in the short-term.


