
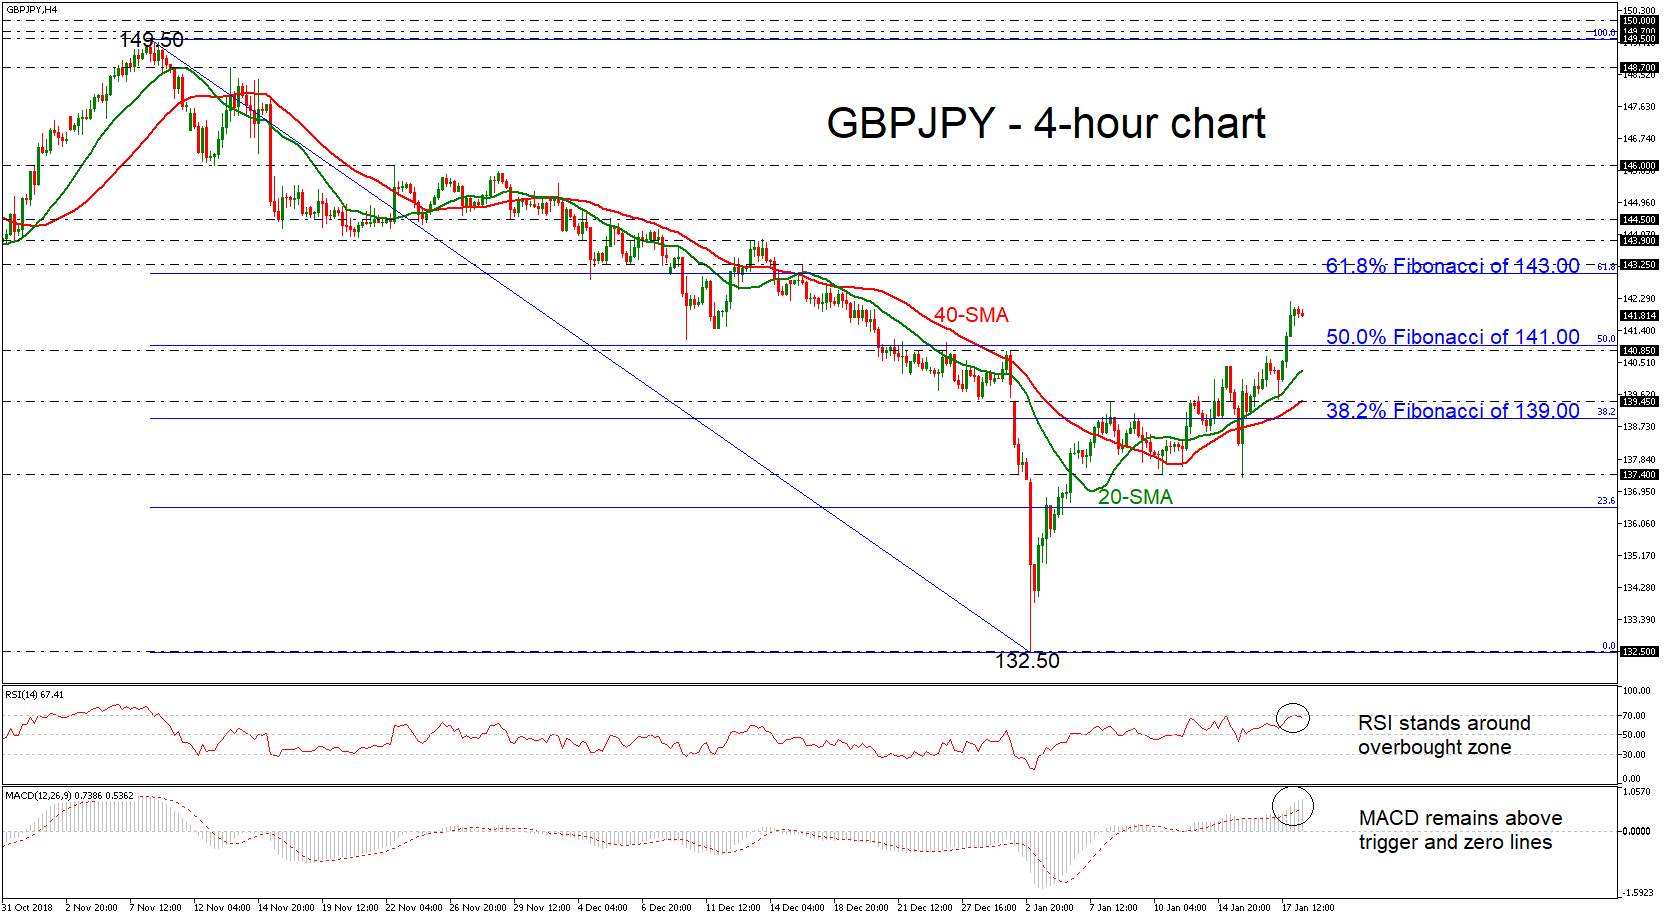
GBPJPY has been advancing considerably for three days in a row, reaching a fresh one-month high of 142.20 during yesterday’s trading session. The price jumped above the strong obstacle of the 50.0% Fibonacci of 141 of the downleg from 149.50 to 132.50, while it also surpassed the 20- and 40-simple moving averages (SMAs) in the 4-hour chart.
Technically, the RSI indicator is trying to enter into the overbought zone, but its momentum is slowing down, while the MACD oscillator holds above trigger line and hovers in the positive territory.
In case of further bullish actions the price could challenge the 61.8% Fibonacci mark of 143.00, which is located near the 143.25 resistance level, taken from the minor peak on December 17. More buying interest could send the price up to the 143.90 resistance, shifting the outlook to a more bullish one.
Alternatively, should the price break below the 50.0% Fibonacci, then the way could open towards the 139.45 support. If the latter proves a weak obstacle, then the next stop for investors to have in mind is the 38.2% Fibonacci of 139.00.
Having a look at the bigger structure, GBPJPY has been developing in a descending movement since November 2018 and only a significant close above the 61.8% Fibonacci would change the outlook from bearish to neutral.


