
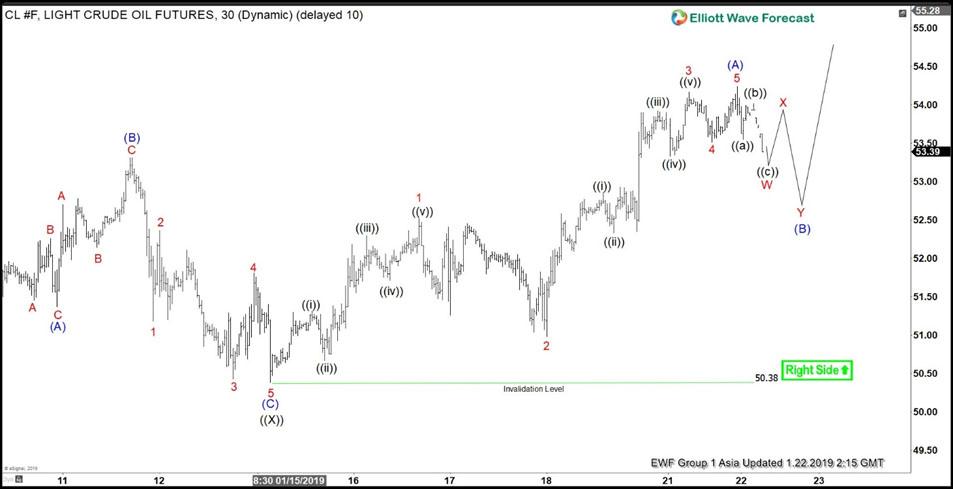
Short term Elliott Wave outlook in Oil (CL_F) is calling for the move lower to $50.38 as ending wave ((X)). Internal of wave ((X)) unfolded as an Expanded Flat Elliott Wave structure. Wave (A) ended at $51.37, wave (B) ended at $53.31, and wave (C) of ((X)) ended at $50.38. Oil has since extended higher above $53.31, suggesting the next leg higher wave ((Y)) has started.
Rally from $50.38 low unfolded as a zigzag Elliott Wave structure where wave (A) ended at $54.24 and wave (B) is in progress. A zigzag is a 5-3-5 structure. We can see the internal of wave (A) unfolded as a 5 waves Impulse. Up from $50.38 low, wave 1 ended at $52.52, and pullback to $50.98 ended wave 2. Rally to $54.17 ended wave 3, wave 4 pullback ended at $53.51 and wave 5 of (A) ended at $54.24.
Expect a pullback in wave (B) to correct cycle from 1/15/2019 low ($50.38) in 3, 7, 11 swing before the rally resumes. As far as pivot at $50.38 low stays intact, favor more upside. If pivot at $50.38 gives up, then Oil is likely correcting larger degree cycle from 12/24/2018 low ($42.36) before the rally resumes.
Oil (CL_F) 1 Hour Elliott Wave Chart


 Elliott Wave: Incomplete Sequences Forecasting The Path")

