
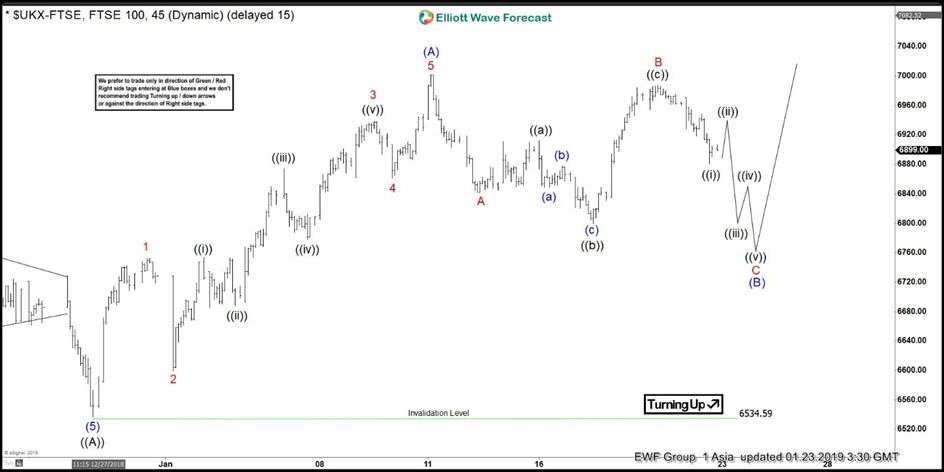
Short term Elliott Wave view in FTSE suggests that the decline to 6534.59 ended wave ((A)). Wave ((B)) bounce is in progress as a zigzag Elliott Wave structure. Up from 6534.59, wave (A) ended at 7001.94. The internal of wave (A) unfolded as a 5 waves Impulse Elliott Wave structure. Wave 1 ended at 6752.54, wave 2 ended at 6599.48, wave 3 ended at 6938.31, wave 4 ended at 6860.82 and wave 5 of (A) ended at 7001.94.
Wave (B) is currently in progress to correct cycle from December 27, 2018 low as a Flat Elliott Wave structure. Down from 7001.94, wave A ended at 6841.74 and wave B ended at 6987.93. Wave C remains in progress as a 5 waves where wave ((i)) of C ended at 6880.69. Short term, while wave ((ii)) bounce stays below 6987.93, Index can see more downside to end the 5 waves down in wave C of (B). Potential target for wave (B) is 6646 – 6769, which is 50 – 76.4 Fibonacci retracement from December 27, 2018 low. Afterwards, as far as pivot at 6534.59 low stays intact in the pullback, Index can resume higher again.
FTSE 1 Hour Elliott Wave Chart


