
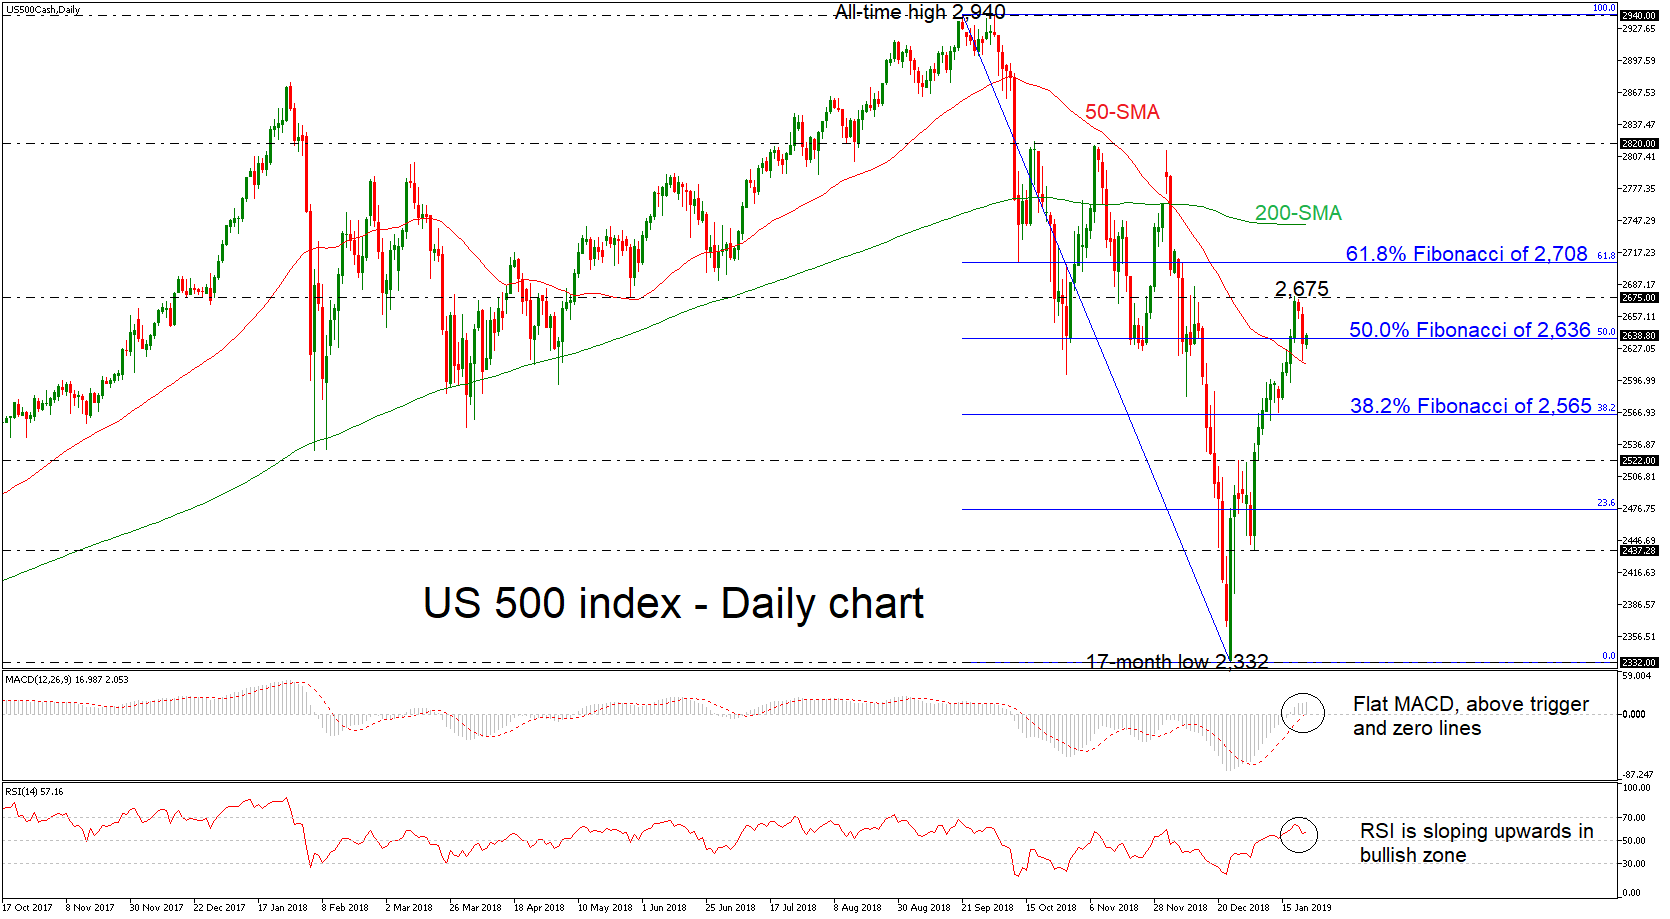
The US 500 stock index found strong support level at the 50-day simple moving average (SMA), creating two consecutive red days, after the aggressive upside rally from the 19-month low of 2,332. The short-term technical indicators support this notion as the RSI is marginally pointing upwards in the positive area, while the MACD lies above trigger and zero lines.
A fresh wave of advances may stall initially near the latest highs of 2,675 before increasing chances for a jump towards the 61.8% Fibonacci retracement level of the downleg from 2,940 to 2,332 around 2,708. A significant leg above this region would switch the neutral outlook to a more bullish one, sending the index until the 200-day SMA currently at 2,743.
On the downside, support to further bearish actions may come around the 50-day SMA of 2,612 and then towards the 38.2% Fibonacci mark of 2,565. Even steeper bearish extensions may encounter support around 2,522, taken from the inside swing peak of December 28.
Overall, US 500 index is in progress of a bullish correction and this action would be confirmed in case of a daily close above 61.8% Fibonacci mark.


