
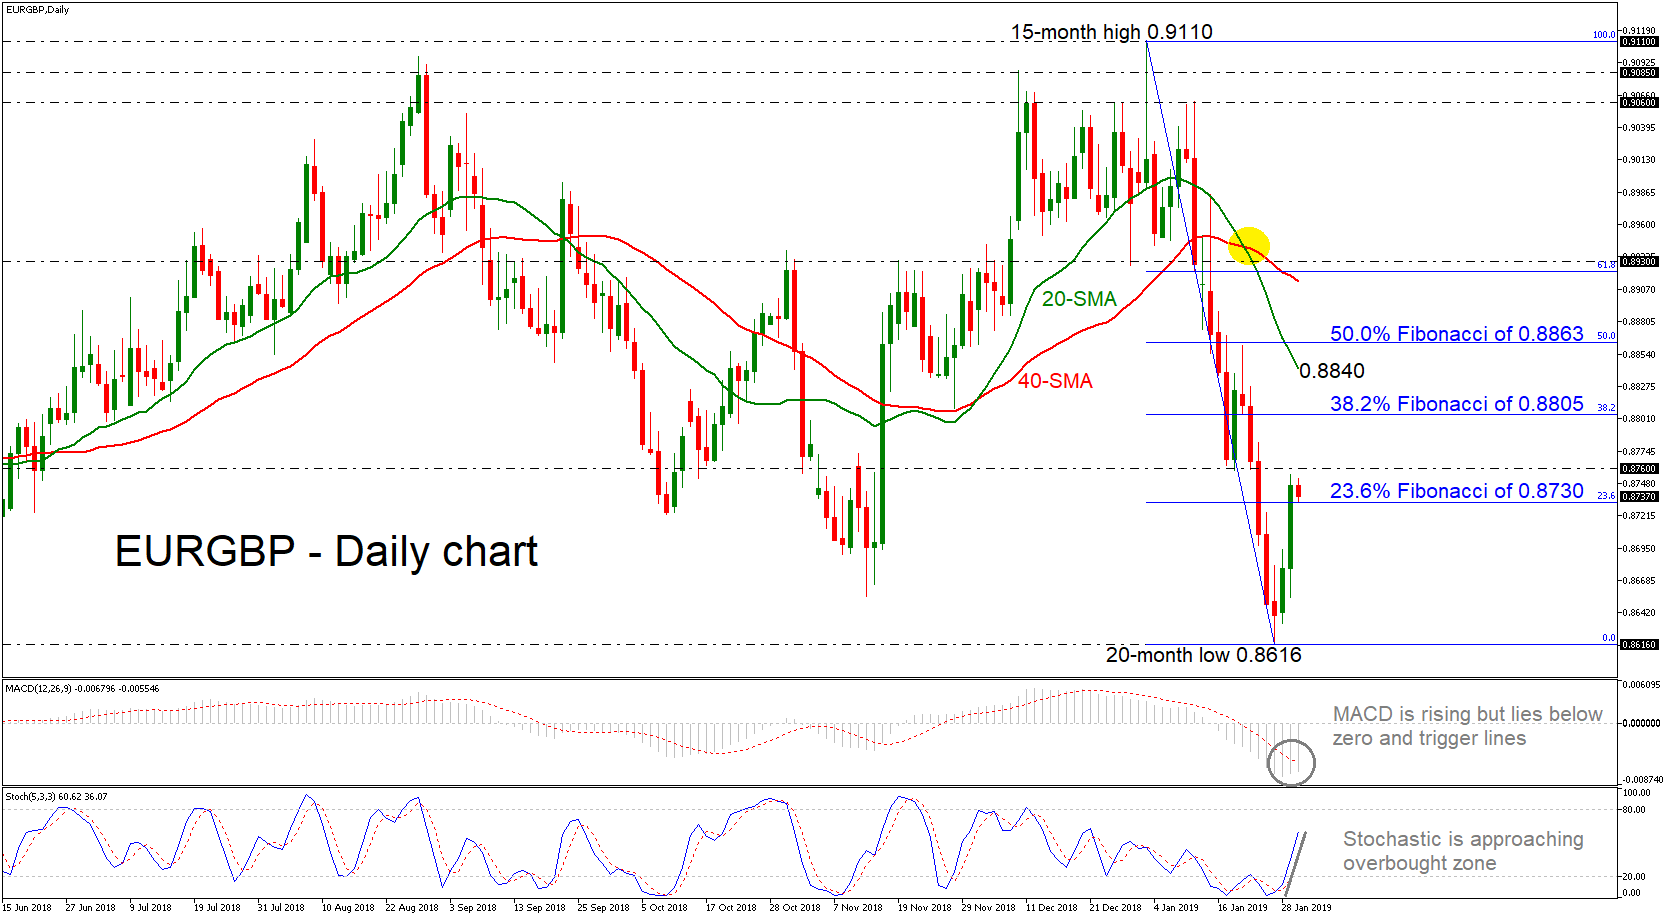
EURGBP had one of its best trading sessions for this year over the last couple of days, following the bounce off the 20-month trough of 0.8616. Also, the pair jumped above the 23.6% Fibonacci retracement level of the downleg from 0.9110 to 0.8616 around 0.8730. However, the price is still lacking direction in the medium term and any daily close below the 0.8620 support level, would endorse the outlook for a negative tendency.
The very short-term bias looks quite positive, however, as the MACD keeps gaining ground below its red signal line and zero line, while the stochastic oscillator is moving higher approaching the overbought territory. On the other hand, the 20- and 40-simple moving averages (SMAs) created a bearish crossover in the preceding week.
The 0.8760 resistance level could be a trigger point for steeper bullish actions as in case of an upward break it would test the 38.2% Fibonacci mark of 0.8805. Higher up, resistance could run towards the 20-day simple moving average (SMA) around 0.8840 before touching the 50.0% Fibonacci of 0.8863.
However, if the pair reverses back to the downside, investors could find strong support area near the 20-month low of 0.8616. If the price continues to drop, support could next come from the inside swing low of 0.8530, registered on April 2017.
Having a look at the bigger picture, EURGBP has been developing in a trading range since September 2017.


