
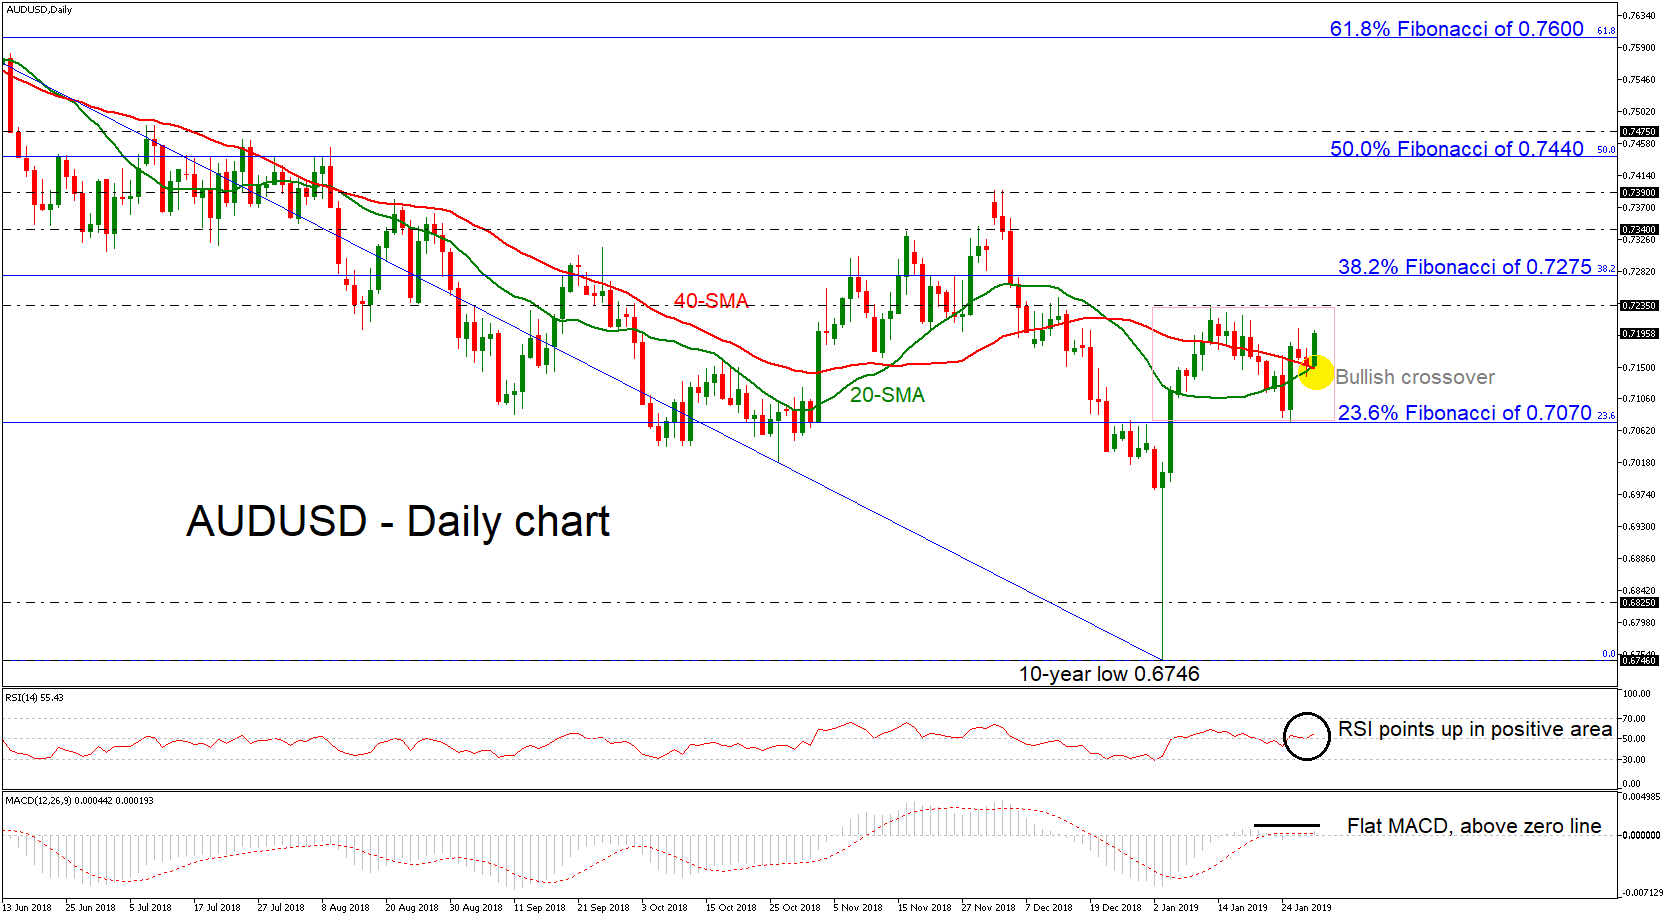
AUDUSD has come under renewed buying interest earlier today finding a strong support level on the bullish crossover between the 20- and 40-simple moving averages (SMAs) in the daily timeframe. After the significant bullish rally from the decade low of 0.6746, the pair is consolidating above the 23.6% Fibonacci retracement level of the downleg from 0.8135 to 0.6746, around 0.7070 and below the 0.7235 resistance.
Momentum indicators now suggest that the market sentiment might get better as the RSI is reversing back to the upside in positive area. However, although the MACD also stands in bullish territory, it is flattening near the zero line.
If the price manages to keep upside movement, nearby resistance could come from the 0.7235 barrier, while further up, the price could rest around the 38.2% Fibonacci mark of 0.7275. A violation of this point may shift attention towards the 0.7340 – 0.7390 resistance area and hence a climb above it could increase speculation that an uptrend is in progress, especially if the pair touches the 50.0% Fibonacci of 0.7440 in the near term.
In the alternative scenario, traders could be eagerly looking for a break below the SMAs to increase selling orders. If that’s the case the rally could last until the 0.7070 support before plunging towards the 0.6825 region, identified by the bottom on January 2016. Steeper declines could open the way for the ten-year low of 0.6746 again.
In the long-term view, AUDUSD has been retaining its descending movement over the last year. Chances for a strong bullish tendency would only come if the pair breaks the 61.8% Fibonacci of 0.7600.


