
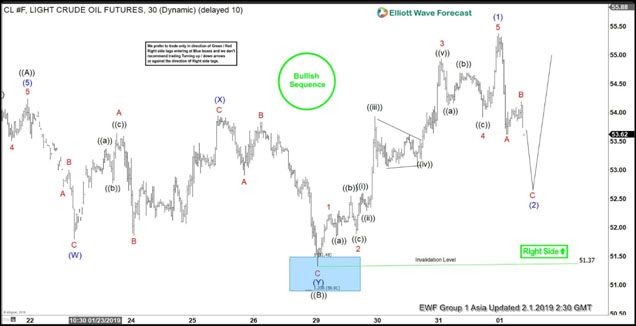
Elliott Wave view calls the rally in Oil to $54.24 ending wave ((A)). From there, the pullback ended with wave ((B)) at $51.37. Internal of wave ((B)) takes the form of a double three Elliott Wave structure. Down from$54.24, wave (W) ended at $51.80, wave (X) ended at $53.94, and wave (Y) of ((B)) ended at $51.37. From there, Oil has resumed higher and broke above wave ((A)) at $54.24. This signals that wave ((C)) has likely started.
The rally from $51.37 is proposed to take the form of a 5 waves Elliott Wave impulse. Up from $51.37, wave 1 ended at $52.24, wave 2 ended at $51.89, wave 3 ended at $54.93, and wave 4 ended at $53.92. The last move higher in wave 5 also ended wave (1) of larger degree at $55.37. Oil is now correcting the entire 5 waves rally within wave (2). The pullback takes the form of a zigzag Elliott Wave where wave A ended at $53.62 and wave B ended at $54.19.
Expect Oil to continue the pullback within wave C of (2) but the pullback should hold above $51.37 for the next leg higher. Potential area for wave (2) is $52 – $52.44 which is 100% – 123.6% Fibonacci extension of A-B. As far as pivot at $51.37, we expect Oil to resume higher. If pivot at $51.37 fails, then Oil is doing a Flat Elliott Wave structure from wave ((A)) high on January 21, 2019.
CL_F 1 Hour Elliott Wave Chart


