
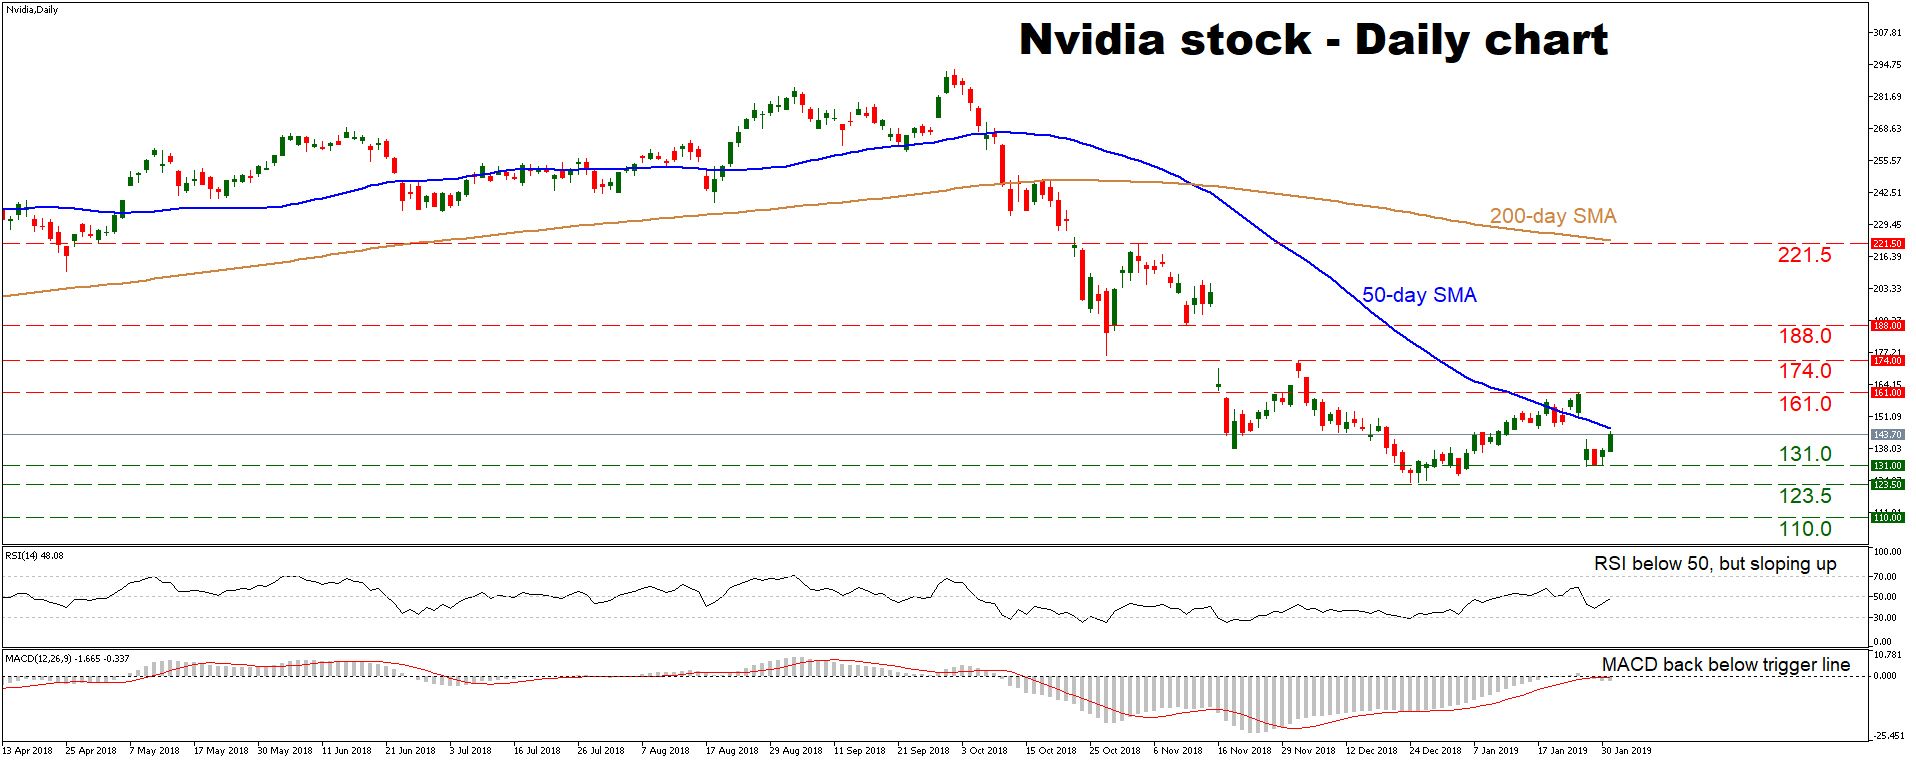
Nvidia’s stock opened with a gap lower on January 28, crossing back below its 50-day simple moving average (SMA). The fact that the price structure on the daily chart still consists of lower highs suggests that the medium-term picture remains cautiously negative, though a decisive break back above the 50-day SMA could turn it to a more neutral one.
Momentum oscillators concur, as the RSI is still below its neutral 50 level but is sloping up while the MACD has just crossed back below its red trigger line.
Assuming a break above the 50-day SMA, currently at 146.0, the next obstacle for the bulls may be the 161.0 zone, defined by the highs of January 25, with even steeper advances aiming for a test of 174.0, the December 3 peak.
On the flipside, another wave lower could encounter support around 131.0, which capped declines on January 29, with a break below that opening the way for the December 24 lows of 123.5. Even lower, that would mark a lower low, shifting attention to the 110.0 zone, marked by the top of March 2017.
Summing up, the picture remains cautiously negative, with a potential break below 123.5 needed to turn it decisively negative. However, a sustained move above the 50-day SMA would paint a more neutral short-term bias.


