
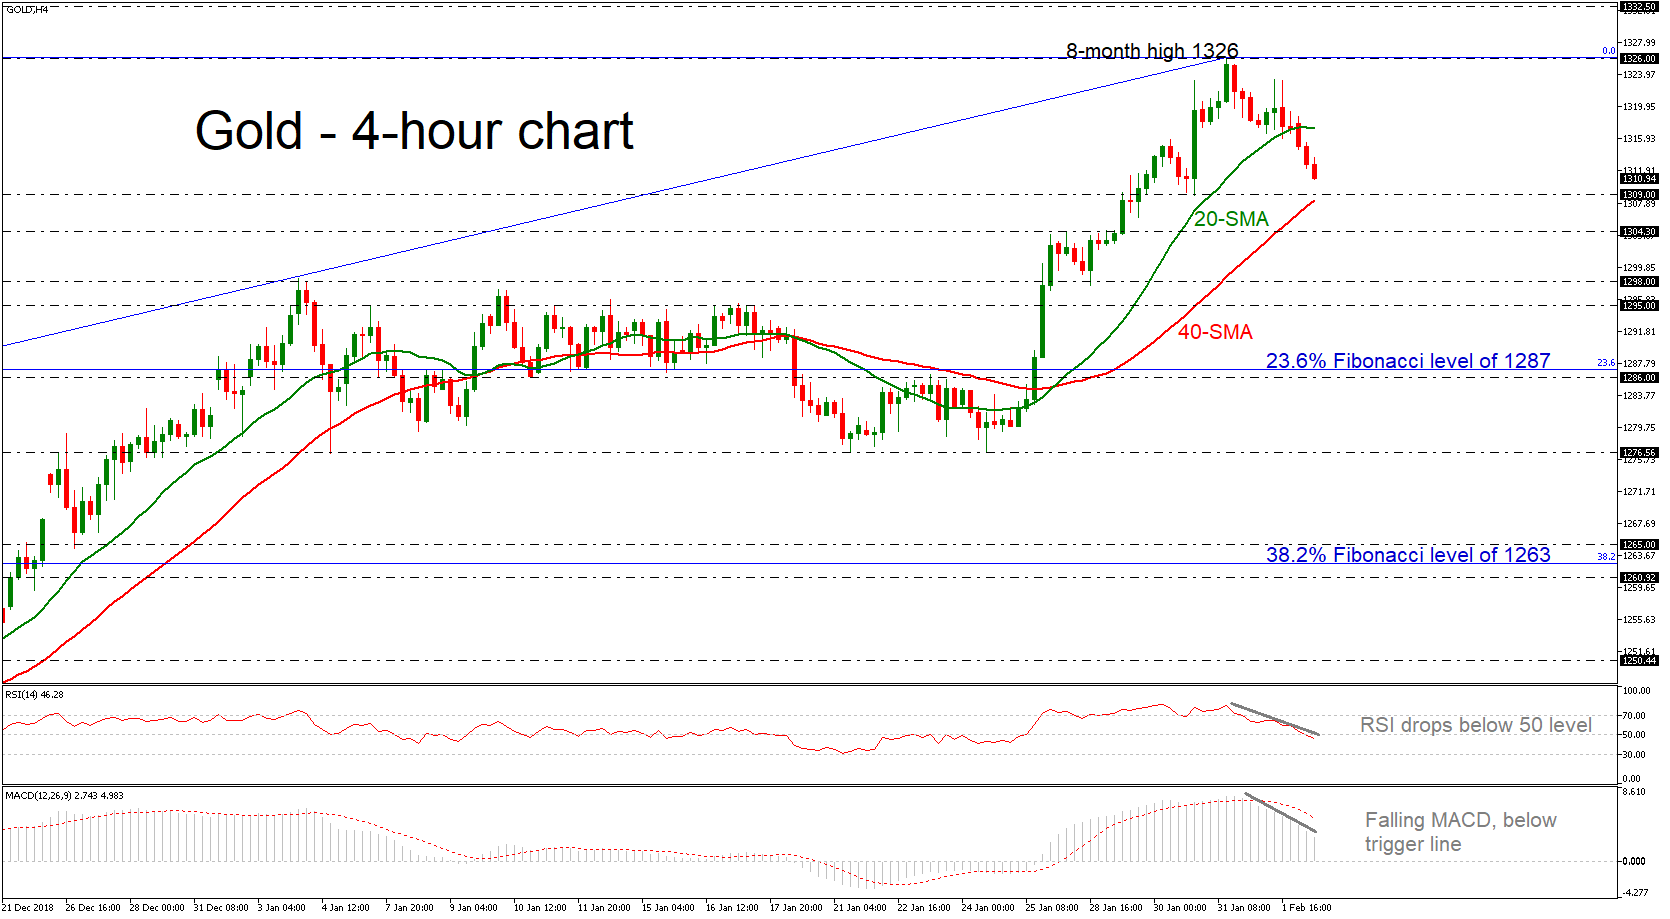
Gold price reversed back to the downside and dropped below the 20-simple moving average (SMA) in the 4-hour chart after finding strong resistance at the eight-month high of 1326 in the prior week. The bias in the very short-term looks bearish as indicated by the RSI which has already entered the negative territory, while the MACD keeps falling below the trigger line, embracing this view as well.
Further declines may meet immediate support around 1309, taken from the latest lows, while slightly lower the 40-SMA could act as strong barrier for the bears. More downside pressures could send the price towards the 1304.30 hurdle, identified by the inside swing top on January 28, before attention shifts towards the 1298 region.
On the other side, resistance could occur around the 20-SMA currently at 1317.50. Even higher, the price could meet a stronger obstacle around the eight-month high of 1326, while a rally above this point could hit the 1355 peak on April 2018.
In the medium-term picture, the market is strongly bullish thanks to the rebound on the 1160 level on August 2018. However, the latest pullback suggests that the bullish action may calm down in the near term.


