
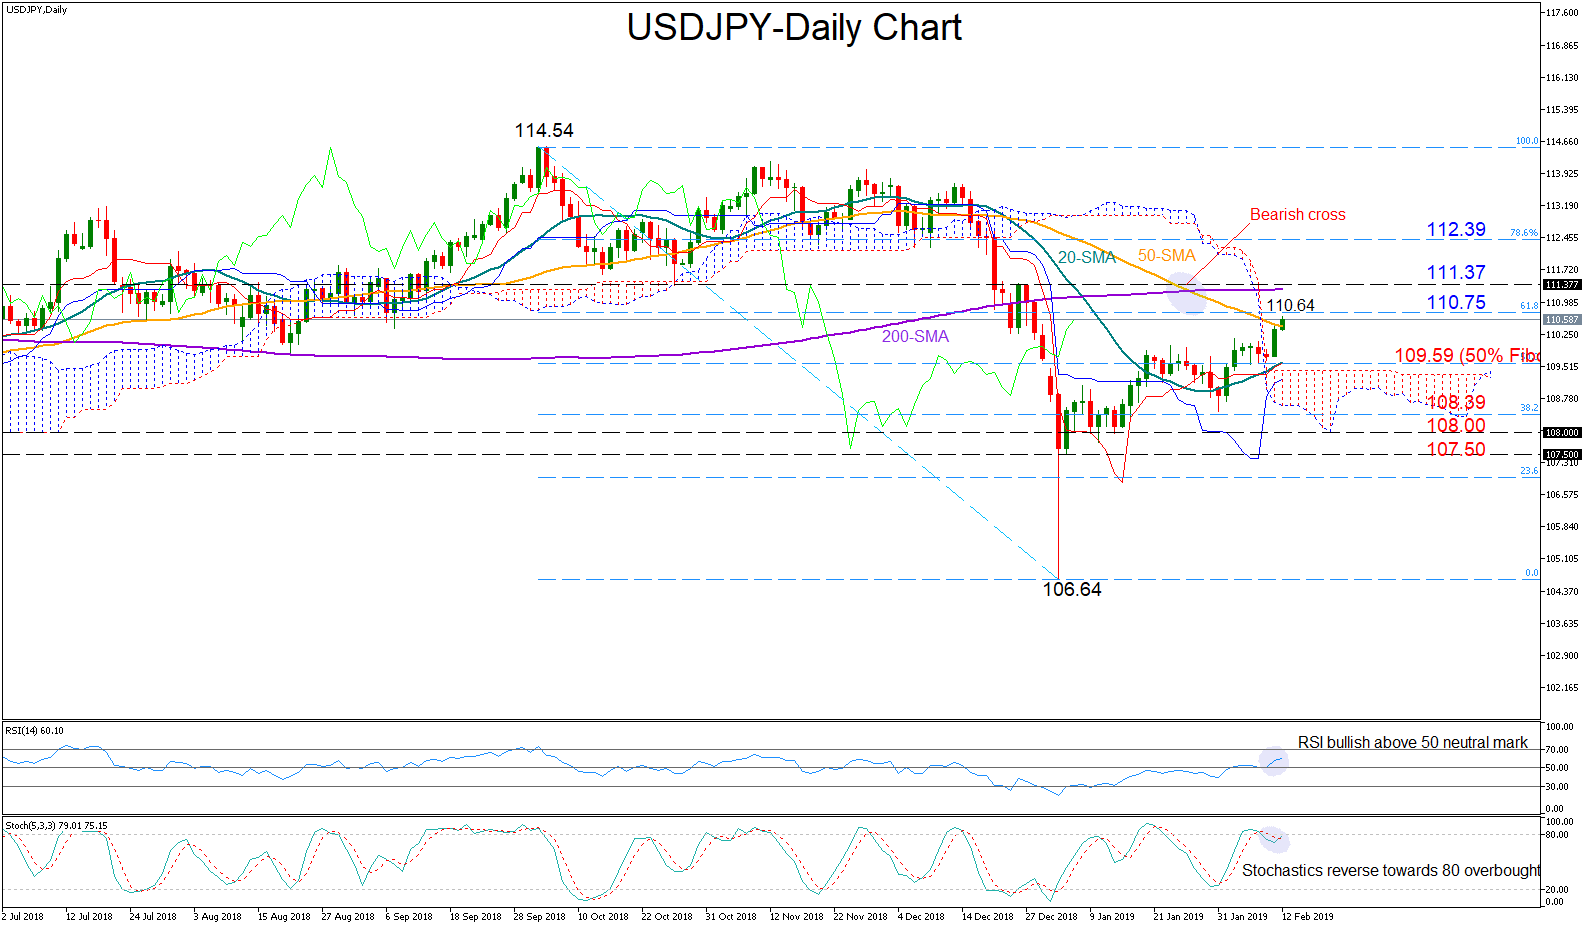
USDJPY cleared the 110 level on Monday and broke slightly above the 50-day moving average (MA) on Tuesday to reach a six-week high of 110.64.
The pair is also trading comfortably above the 20-day MA and the Ichimoku cloud, giving positive trend signals for the short-term. Momentum indicators are also in bullish territory, with the red Tenkan-sen line improving above the blue Kijun-sen line and the RSI increasing steam after the rebound on the 50 neutral threshold. The fast Stochastics, though, are still close to the 80 overbought mark, warning that the bears might be around the corner.
Should bullish pressure violate the 61.8% Fibonacci of 110.75 of the downleg from 114.54 to 104.64, important resistance could appear around the 200-day MA which currently stands at 111.37. A decisive close above that line could trigger steeper increases, shifting the focus towards the 112.50 restrictive area where the 78.6% Fibonacci is also located.
In the alternative scenario, the price could weaken towards the 50% Fibonacci of 109.59, while lower support could be found near the 38.2% Fibonacci of 108.39. if the latter fails to halt downside movements, the pair could subsequently retest support between 108 and 107.50.
In the medium-term picture, the outlook remains negative as long as the market holds below 111.37. The bearish cross between the 50- and the 200-day MA, signals that things could turn worse before getting better in the medium term.


