
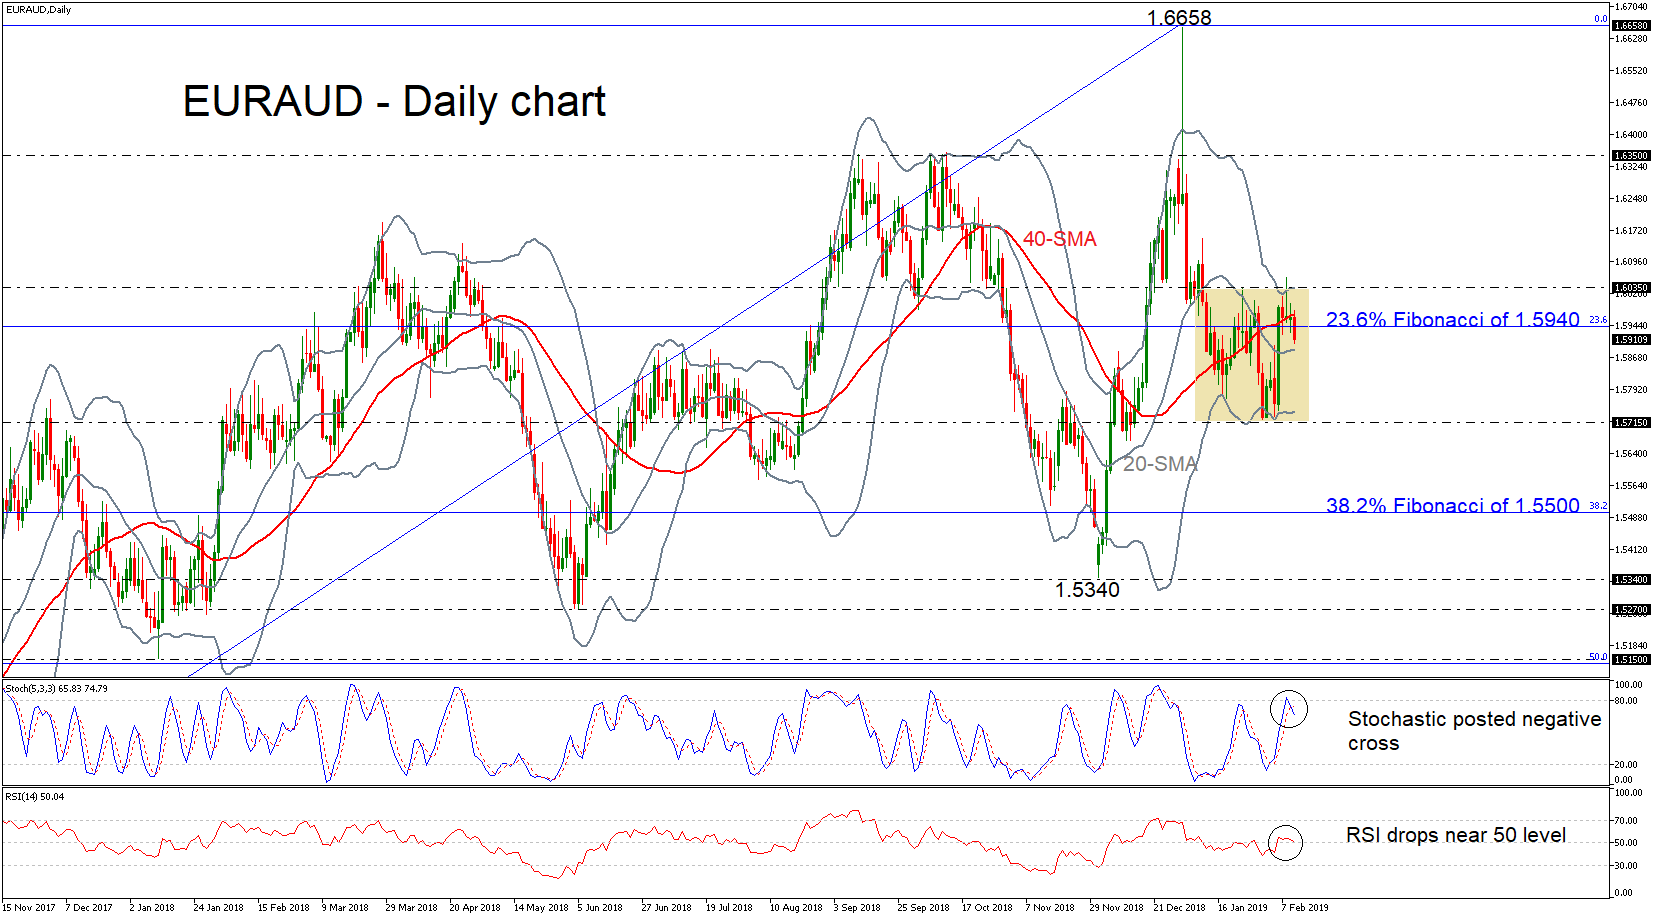
EURAUD is retreating near 1.5900 below the 23.6% Fibonacci retracement level of the upleg from 1.3625 to 1.6558, approaching the mid-level of the Bollinger Band (20-simple moving average) in the daily chart. Over the last month, the price has been moving sideways in the Bollinger Band within the 1.5715 support and the 1.6035 resistance.
The technical structure suggests a bearish momentum as well. The stochastic oscillator printed a bearish crossover within the %K and %D lines slightly below the overbought zone, while the RSI indicator is trying to enter the negative territory.
An extension to the downside and below the 20-day SMA could meet the support level of 1.5715. Further down, support could run towards the 38.2% Fibonacci near the psychological level of 1.5500.
On the other side, if the pair strengthens, the 23.6% Fibonacci and the 40-day SMA could act as strong resistance obstacles for the bulls. A jump above these lines could find immediate resistance near the upper Bollinger band, which overlaps with the 1.6035 barrier. A bullish run higher could send prices towards the 1.6350 hurdle, recorded on October 11.
The long-term picture continues to look predominantly bullish, with trading activity taking place above both the 50- and 200-SMAs.


