
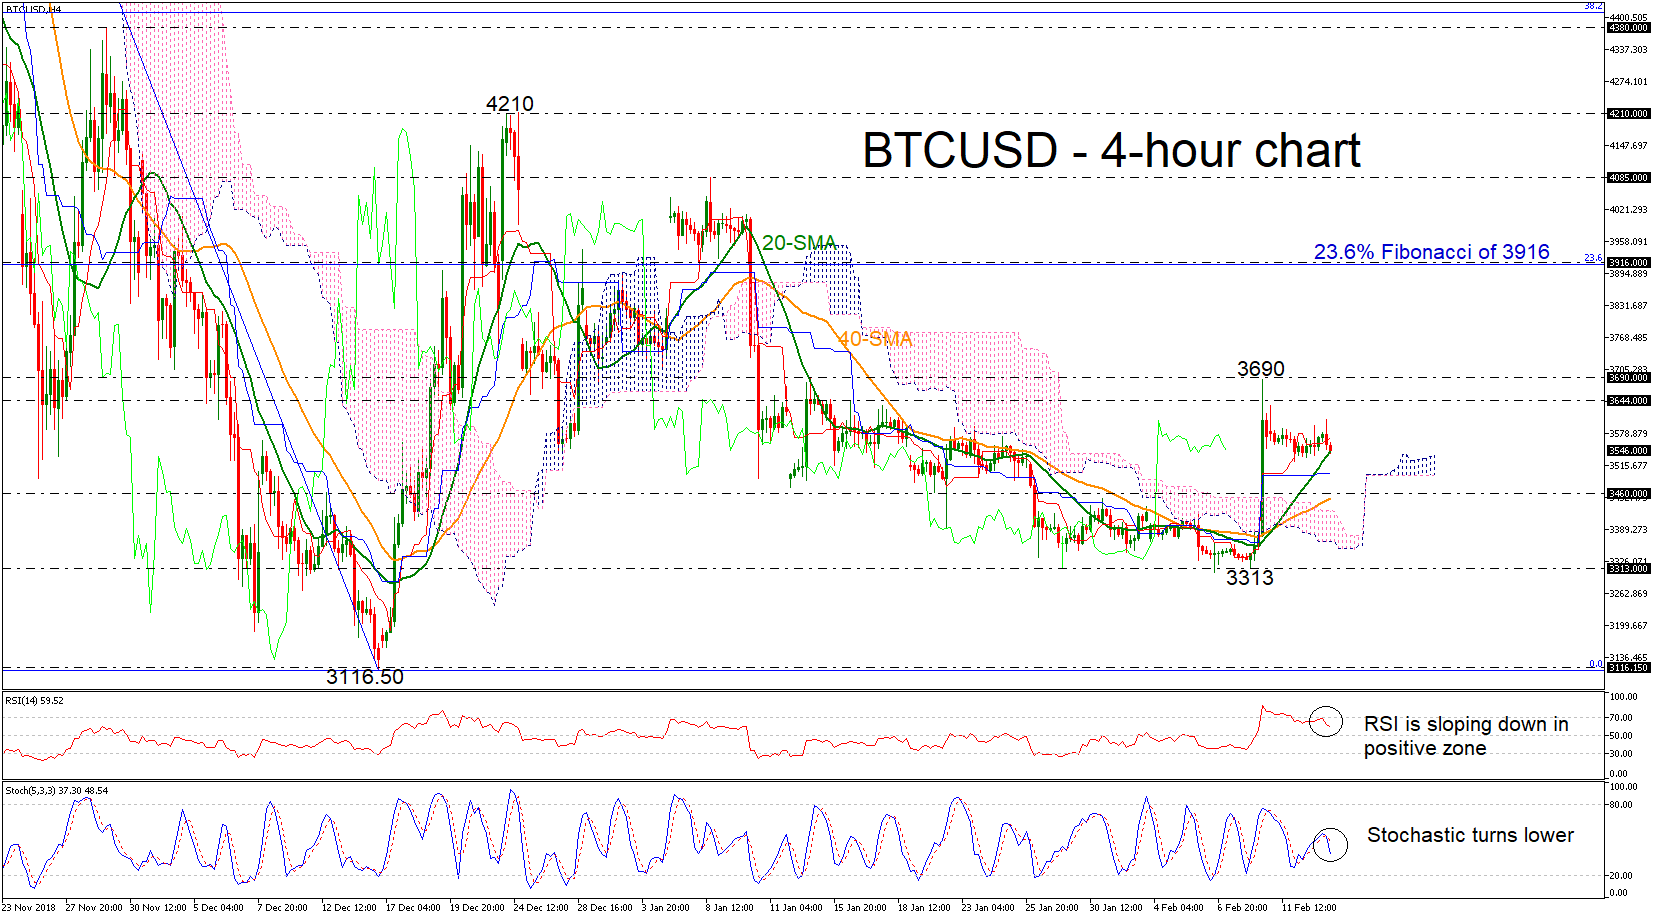
BTCUSD skyrocketed last Friday, jumping above the Ichimoku cloud and the 20- and 40-simple moving averages (SMAs) in the 4-hour chart. Currently, the price is moving sideways, and the technical indicators have turned lower. The RSI indicator is moving down in the positive zone while the stochastic oscillator is approaching the oversold territory.
Should the price extend higher, it could find resistance at the 3644 level, before touching the latest high of 3690. Also, an advance above this region would increase speculation that a bullish move is in progress towards the 23.6% Fibonacci retracement level of the downleg from 6508 to 3116.50, around the 3916 resistance level.
On the flipside, if the price heads south, immediate support is coming from the 3460 barrier, which stands near the 40-SMA. A step lower could bring bearish sentiment back into play in the near term taking the price towards the 3313 hurdle.
To sum up, the very short-term bias remains neutral, however, in the long-term view the bearish structure holds, as it has over the last year.


