
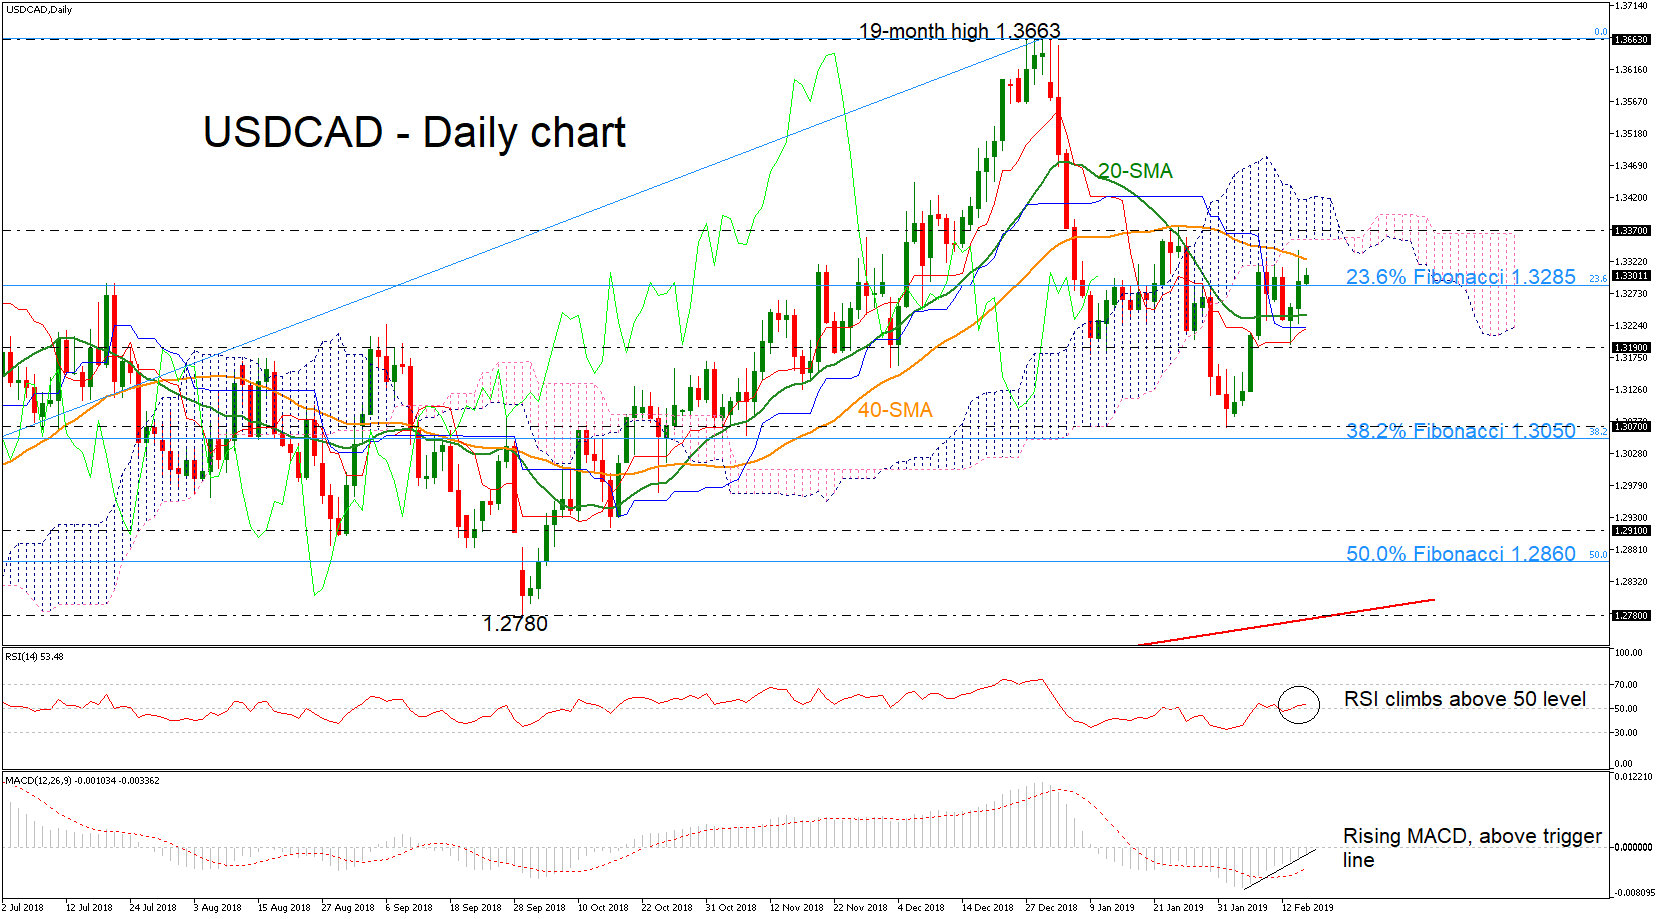
USDCAD came to close to break the 40-day simple moving average (SMA), surpassing the 23.6% Fibonacci retracement level of the upward movement from 1.2060 to 1.3663, around 1.3285, earlier today. The positively aligned Tenkan-sen line serves as a testament to the bullish short-term momentum that is in place. The technical indicators also suggest a positive bias as the RSI entered in bullish territory, while the MACD is rising above the trigger and zero lines.
Should the price stretch north, Thursday’s highs and the 40-SMA could provide immediate resistance around 1.3330 before the pair touches the 1.3370 resistance level. A significant step higher could bring the bullish sentiment back into play, sending the prices towards the 19-month high of 1.3663.
On the other side, the price could challenge the flat 20-day SMA near 1.3240 before heading lower towards the 1.3190 support barrier. If traders continue to sell the pair, the price could fall until the 1.3050 – 1.3070 area, which encapsulates the 38.2% Fibonacci mark. A drop below this key zone would reverse back to the downside, continuing the bearish correction until the 1.2910 region.
Summarizing, dollar/loonie has been developing in an ascending movement since September 2017 in the long-term, while over the last two months the price has been creating a negative tendency, following the pullback from the 19-month high.


