
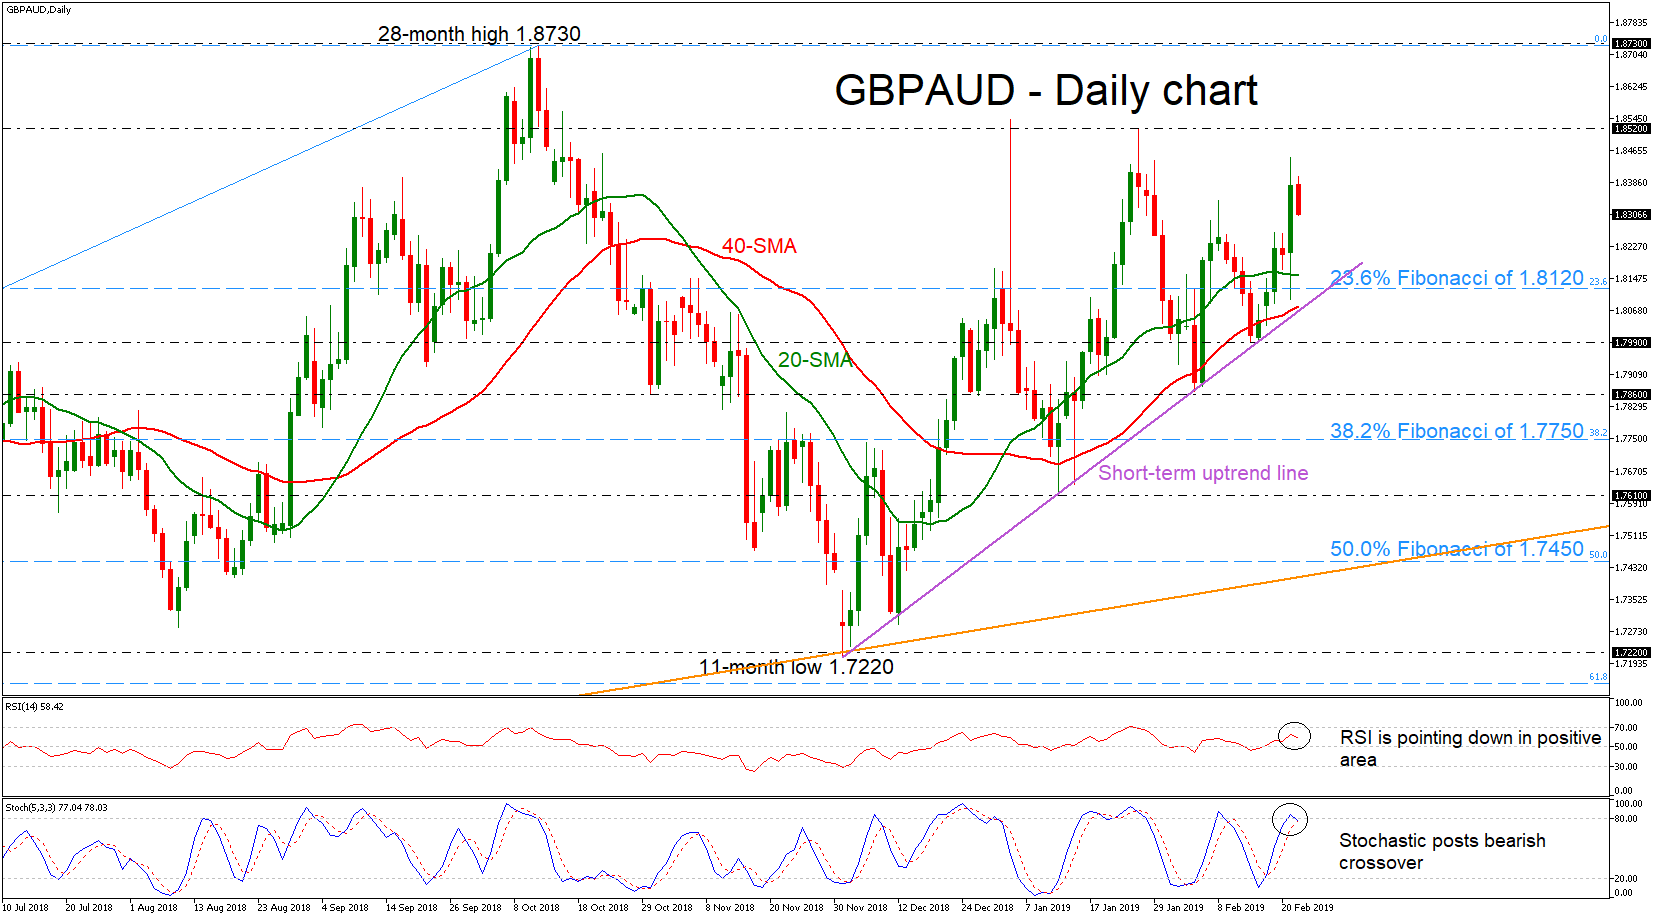
GBPAUD is paring yesterday’s gains significantly above the 23.6% Fibonacci retracement level of the upleg from 1.6160 to the 28-month high of 1.8730. The technical indicators have a steeper negative slope now. The RSI is heading towards the neutral threshold of 50, while the stochastic is moving down, attempting a bearish cross within the %K and %D lines in the daily chart.
Should the price retreat further, the 20-simple moving average (SMA) around 1.8155 could act as support before slipping again towards the 23.6% Fibonacci. Moving lower, the focus would shift to the 1.7990 support area, while lower still, a violation of this barrier and the short-term uptrend line would increase speculation that the bullish phase has ended and has switched to neutral.
To the upside, buyers could turn their attention to the 1.8520 latest high. Further up, the area around 1.8730 comes into view before pushing prices until the 28-month high of 1.8730, achieved on October 2018.
Overall, GBPAUD in the long term has been trading within an upside rally since October 2016, creating higher highs and higher lows during this period.


