
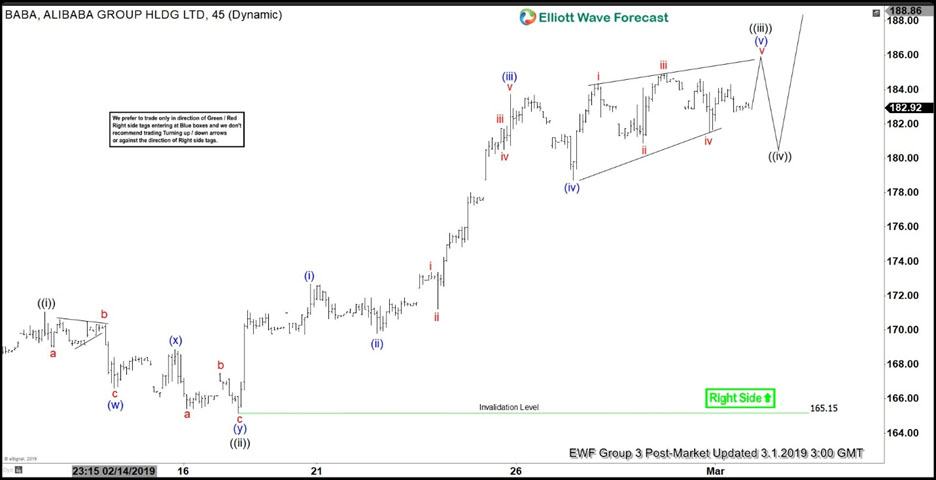
Short Term Elliott Wave view in Alibaba is bullish with the rally from February 8, 2019 low ($163.58) unfolding as an impulse. Furthermore, the cycle starting from January 23, 2019 low has not reached 100% target, thus still favoring further upside. Near term, rally from Jan 23 low to $171.05 ended wave ((i)) and pullback to $165.14 ended wave ((ii)). Wave ((iii)) is currently in progress and the subdivision is also an impulse structure of lesser degree.
Up from $165.14, wave (i) ended at $172.68, wave (ii) ended at $169.8, wave (iii) ended at $183.72, and wave (iv) ended at $178.71. Wave (v) is unfolding as an ending diagonal and we can see 4 overlapping waves already forming within wave (v). Another leg higher is expected before ending wave (v) of ((iii)). The stock should then pullback in wave ((iv)) to correct cycle from Feb 19, 2019 low in 3, 7, or 11 swing before the rally resumes. Potential target to the upside is 100% – 123.5% Fibonacci extension from Jan 23 low which comes at $186.55 – $191.95. As far as pivot at $165.15 stays intact, favor more upside in Alibaba in near term.
1 Hour Crude Alibaba (BABA) Elliott Wave Chart


 Elliott Wave: Incomplete Sequences Forecasting The Path")

