
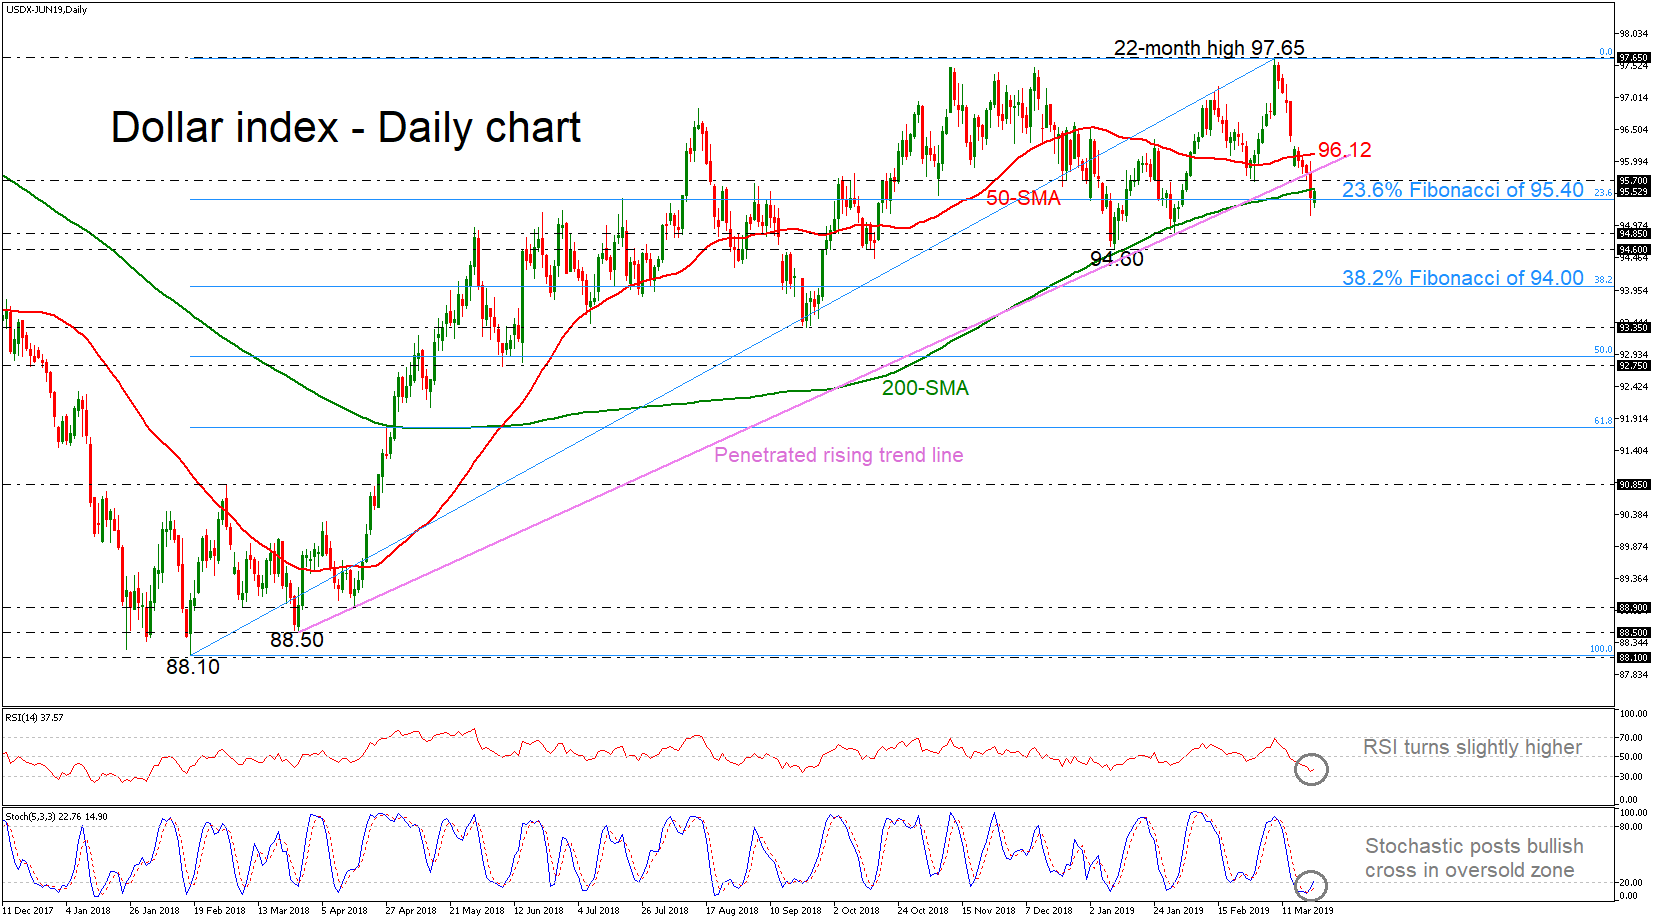
The US dollar index is paring some losses from yesterday above the 23.6% Fibonacci retracement level of the upleg from 88.10 to 97.65 and closer to the 200-day simple moving average (SMA). On Wednesday, the price dropped below the rising trend line, which had been holding since March 2018, giving negative trend signals for the near future.
However, the short-term bias is tilted to the upside as the RSI indicator is turning marginally higher below its 50 level, while the stochastic oscillator is sloping up after posting a bullish crossover within the %K and %D lines in the oversold zone below 20.
The 94.85 – 94.60 support zone could be a trigger point for bearish actions if the index manages to slip below the 23.6% Fibonacci level. If the price continues to drop, support could next come somewhere around the 38.2% Fibonacci of 94.00, confirming the neutral to bearish view below the diagonal line.
On the other side, if the indicators continue to improve, the index could jump above the 200-day SMA and the 95.70 resistance level to reach the 50-day SMA currently at 96.12. A sharp bullish move could also hit the 22-month high of 97.65.
In the medium term, the dollar index seems to bearish to neutral and only a jump above the 97.65 could change the outlook to bullish. On the other side, a drop beneath the 38.2% Fibonacci could switch the recent view to strongly negative.


