
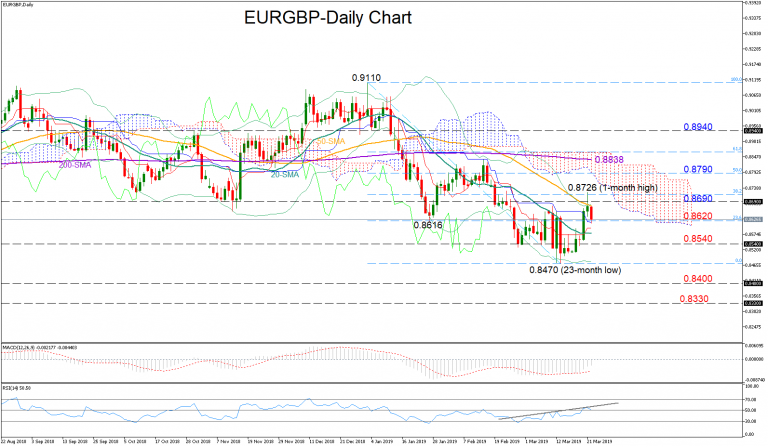
EURGBP pierced the 50-day moving average and a key support and resistance area around 0.8690 on Thursday to reach a one-month high of 0.8726. Gains though appeared short-lived, with the price starting Friday’s trading in negative mood.
Meanwhile in momentum indicators, the RSI has posted a new higher high along its uptrend line and is now heading lower, while the MACD continues to strengthen steadily above its red signal line and towards positive territory, both framing a positive-to neutral picture. It is also worth noting that the price action is currently taking around the upper Bollinger band, therefore room for improvement could be limited.
Breaching the previous high of 0.8726 and therefore the 38.2% Fibonacci of the downward wave from 0.9110 to 0.8470, could send the price up to the 0.8790-0.8838 familiar area, encapsulated by the 50% Fibonacci and the 200-day MA respectively. Beyond that, the 61.8% Fibonacci of 0.8865 could halt upside movements ahead of a stronger barrier placed around 0.8940.
An extension lower could meet immediate support from the 23.6% Fibonacci of 0.8620. Dropping below this mark, attention would reasonably shift to 0.8540, which has been quite challenging for the bears this month. If the decline continues, then the 23-month low of 0.8470 will be crucial for the sell-off to pick up steam towards 0.8400 and 0.8330, last visited in 2017.
In the medium-term picture EURGBP is trading in a downtrend since the start of the year. A close under the 0.8470 bottom would make the downleg more concrete in investors’ eyes.


