
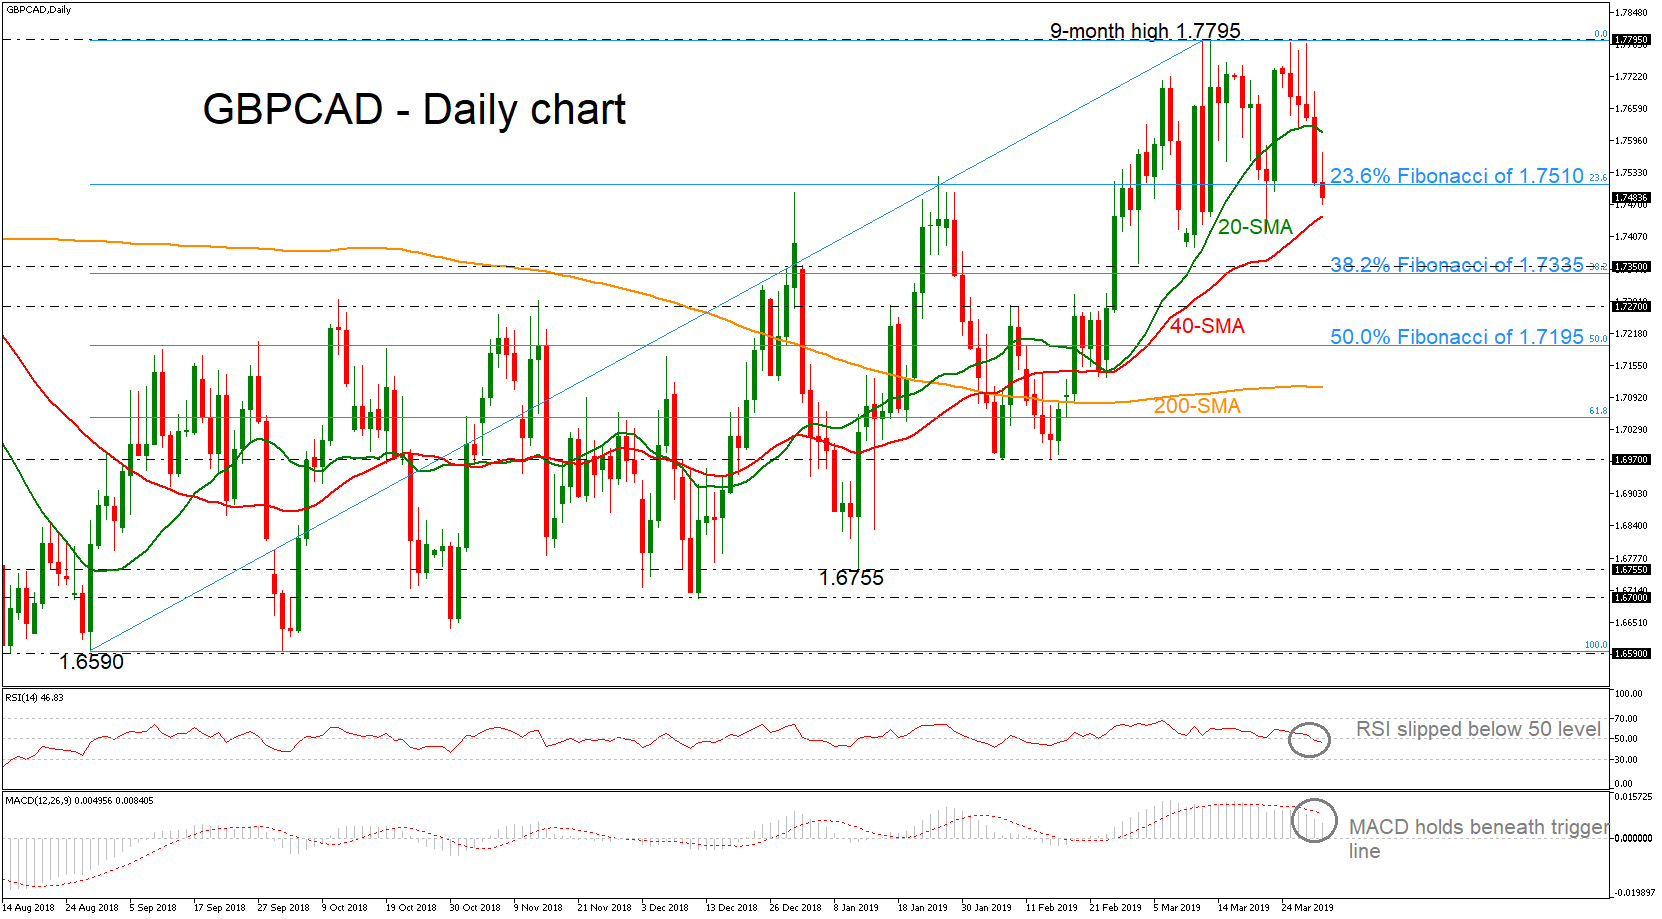
GBPCAD declined below the 23.6% Fibonacci retracement level of the upward movement from 1.6590 to 1.7795, near 1.7510 on Friday. The technical indicators are slowing down, mirroring the market’s behavior over the last days as the RSI is dropping below the 50 level, while the MACD is also holding in the bullish area, however, it slipped below the trigger line.
In case the pair changes its short-term direction to the downside, the bears would probably challenge the 40-day simple moving average (SMA) currently around 1.7450 and then could hit the support at the 1.7350, which stands near the 38.2% Fibonacci mark of 1.7335. A break lower, could last until the 1.7270 barrier.
Alternatively, additional increases may drive the price towards the 20-day SMA currently at 1.7615 and then could challenge the nine-month high of 1.7795. Above the latter, the 1.7980 resistance, registered on April 2018 comes into view.
In the more medium-term picture, the slightly bullish correction shifted to a stronger positive tendency, however, it failed several times over the last sessions to post a higher high.


