
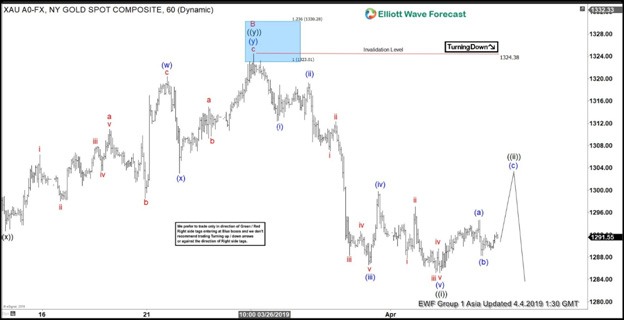
Elliott Wave view suggests that Gold has ended cycle from August 16, 2018 low ($1160.37). The yellow metal is currently correcting that cycle as a zigzag Elliott Wave structure. Down from Feb 20, 2019 high, wave A ended at $1281.01 and wave B ended at $1324.38. The yellow metal still needs to break below wave A at $1281.01 to validate this view.
Wave C is in progress as a 5 waves impulse Elliott Wave structure. Down from $1324.38, wave ((i)) ended at $1285.17. In the 1 hour chart below, we can see wave ((i)) subdivides as an impulse of a lesser degree. Wave ((ii)) bounce takes the form of a zigzag structure where wave (a) ended at $1294.36 and wave (b) ended at $1288.20. Near term, while wave ((ii)) bounce stays below $1324.38, expect Gold to extend lower. Projected area of wave ((ii)) comes at $1297 – $1303 where wave (a) = wave (c).
1 Hour XAUUSD Elliott Wave Chart


