
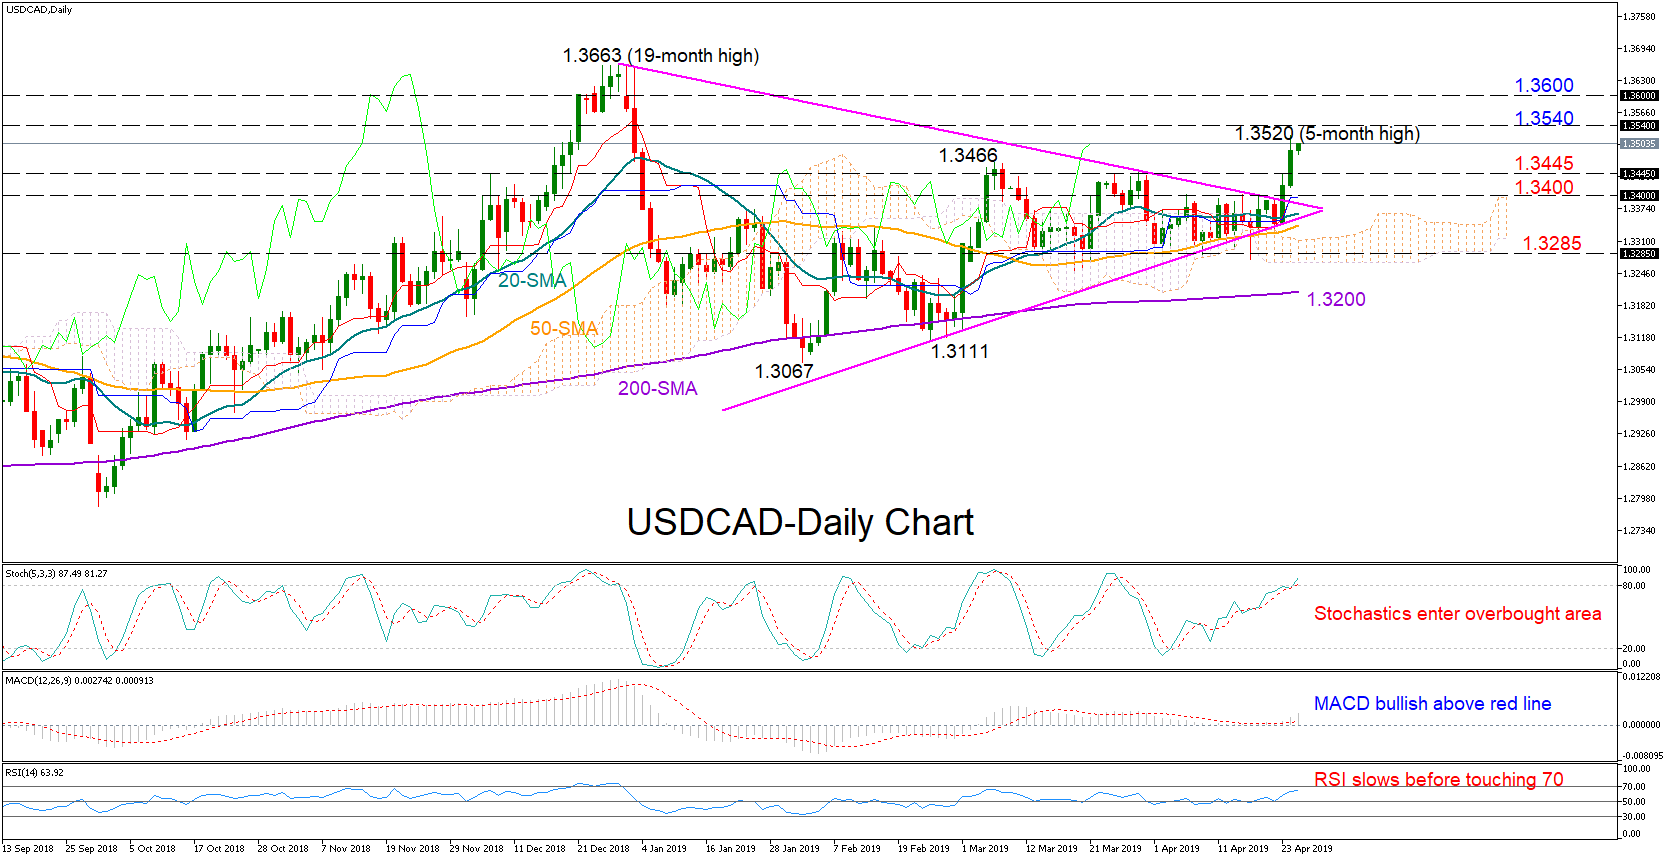
USDCAD has successfully broken the upside border of the symmetrical triangle on Tuesday, letting the bulls to comfortably run as high as 1.3520 on Wednesday – near five-month highs. The market, however, seems to be nearing overbought zone according to the fast Stochastics that are searching for a bearish cross above 80, with the slowing RSI backing this view as well. Still, any weakness could prove short-lived if the MACD keeps strengthening above its red signal line.
The area between 1.3540-1.3600 has been a key resistance during 2016-2017 and any violation may welcome fresh bullish action, with the 1.3663 peak being the next target on the way. Should the pair beat that ceiling, the focus will shift straight to the 2017 highs of 1.3769 and 1.3792.
Otherwise, a failure to return above 1.35 may increase selling orders towards the 1.3445-1.3400 restrictive region, while slightly lower, the 1.3285 mark could be the trigger point for a steeper decline that could lead the price down to the 200-day moving average (1.3200).
In the medium-term timeframe, yesterday’s close above the 1.3466 number shifted the outlook slightly positive in the three-month picture. Traders, however, would likely wait for the price to pierce above 1.3540 to confirm the outlook reversal.
In brief, USDCAD is bullish and close to overbought levels in the short-term picture, while in the medium-term, the view has turned slightly positive from neutral. Yet a confirmation for the latter is still needed.


