
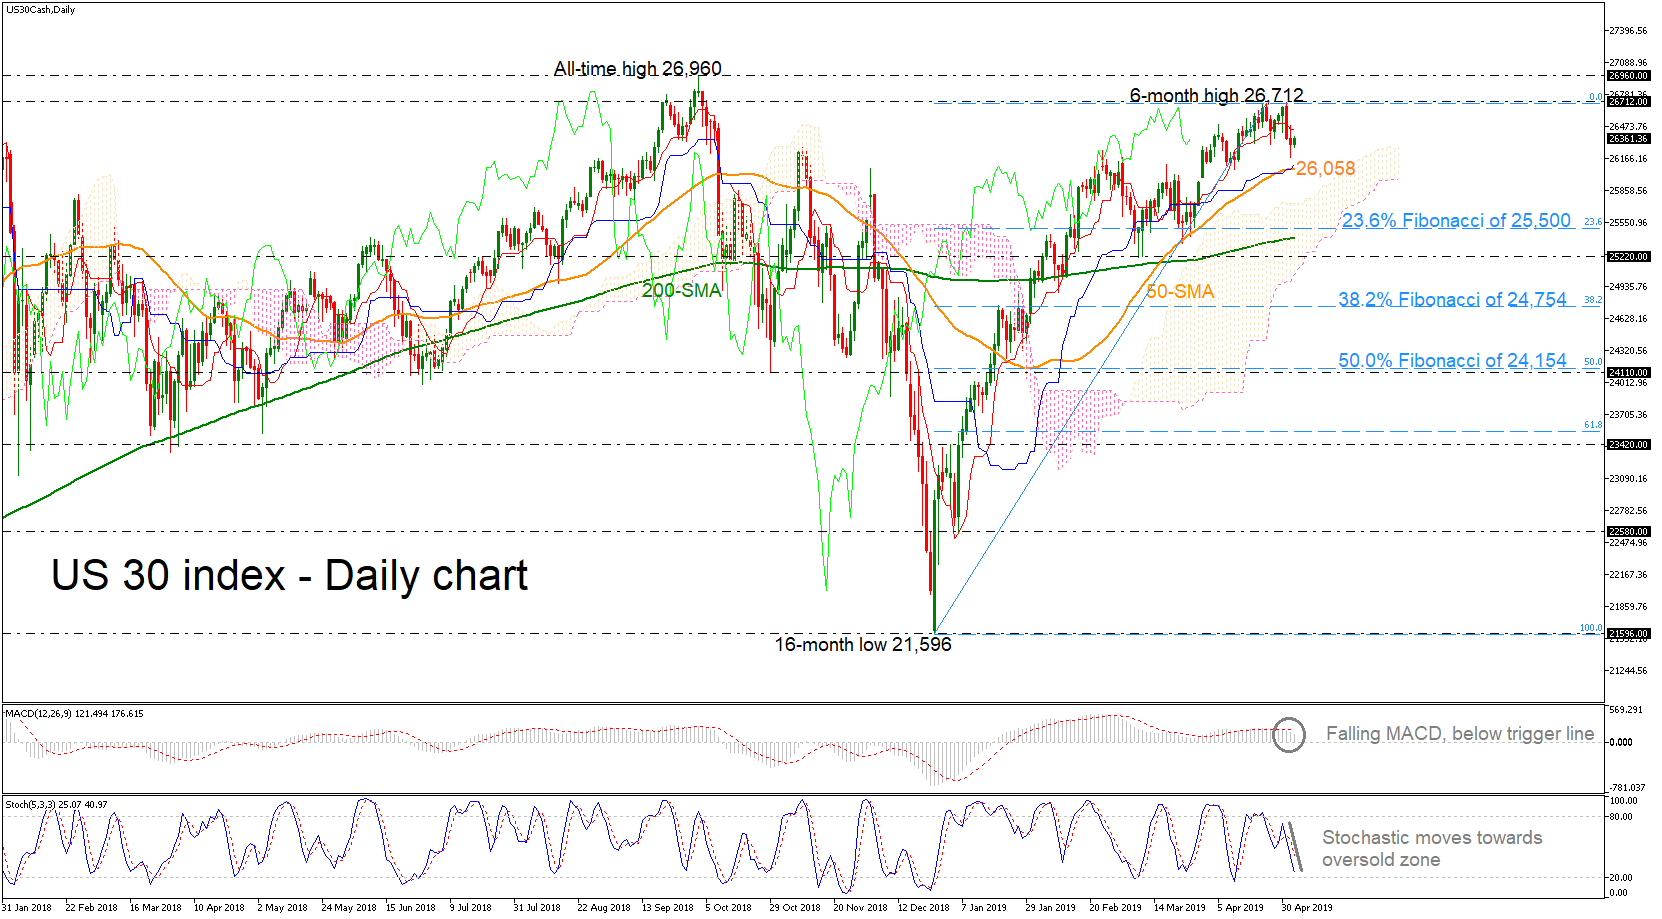
The US 30 index is trading below the six-month high of 26,712, remaining well above the ‘golden cross’ between the 50- and 200-day simple moving averages (SMAs). The index is on the back foot and the technical indicators suggest that the market could ease a little bit in the short-term; the MACD is easing in the positive zone, while the stochastic is approaching the oversold zone.
In case of a correction lower, preliminary support may be initially found in the crossroads of the 50-day SMA and the blue Kijun-sen line, around at 26,058, and then near 25,500 which is where the 23.6% Fibonacci retracement level of the upleg from 21,596 to 26,712 and the 200-day SMA are currently located. Falling towards the 25,220, the medium-term picture would shift from bullish to neutral.
On the other hand, if the bulls maintain control, immediate resistance could come around the six-month high of 26,712, where the rally topped on April 24. If buyers pierce above that, the next obstacle may be the all-time high of 26,960.
Summarizing, in the near-term, the momentum indicators point to a possible bearish retracement, however, the index is still creating higher highs and higher lows over the last couple of months, which augurs well for the medium-term.


