
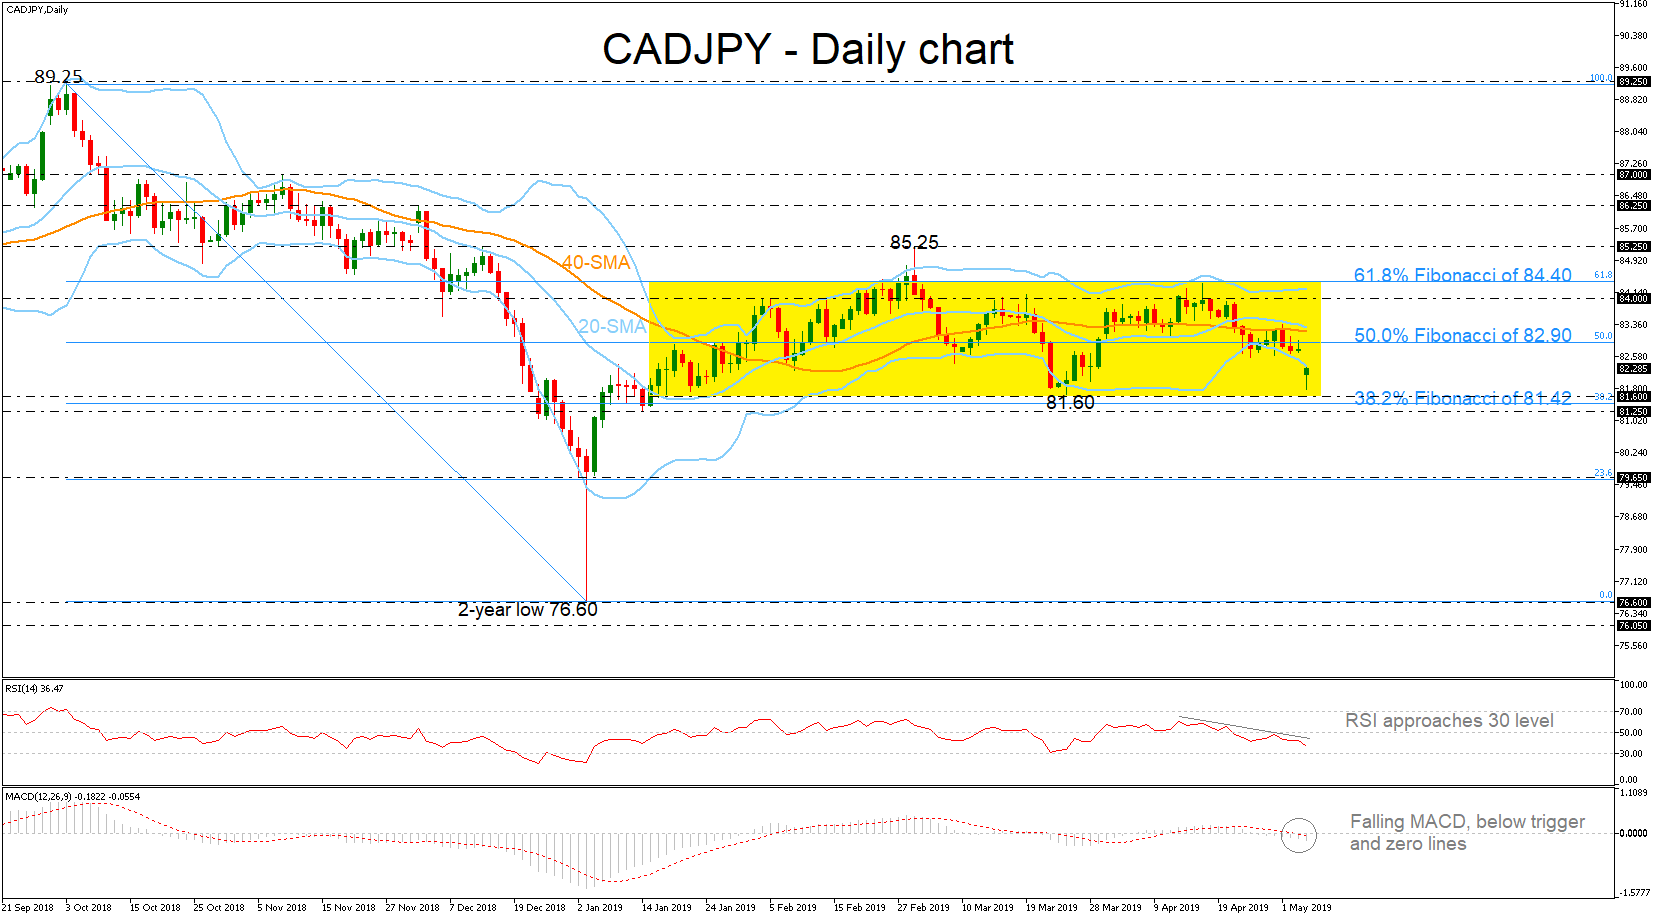
CADJPY has been finding strong support on the 81.60 barrier, after the gap down earlier on Monday, falling beneath the lower Bollinger band in the daily chart. Since the mid-January, the pair has been trading within a narrow range from 61.8% Fibonacci of the downleg from 89.25 to 76.60 near 84.40 until the 81.60 support.
Having a look at the momentum indicators, the RSI is pointing down below the neutral threshold of 50 and the MACD is hovering marginally below the trigger and zero lines.
A step lower could find immediate support at the 81.60 level, the 38.2% Fibonacci of 81.42 and the 81.25 hurdle. More downside pressures could drive the pair towards the 23.6% Fibonacci of 79.65, increasing bearish sentiment.
An advance above the 50.0% Fibonacci of 82.90 could open the door for bullish actions until the 84.00 psychological level and the 61.8% Fibonacci of 84.40. If there is a successful daily close above the aforementioned obstacle, the pair could push until 85.25, while a sharper move higher could shift the neutral bias to more bullish one, testing 86.25.
However, a break below the 38.2% Fibonacci and the 81.25 support could confirm the long-term negative momentum.


