
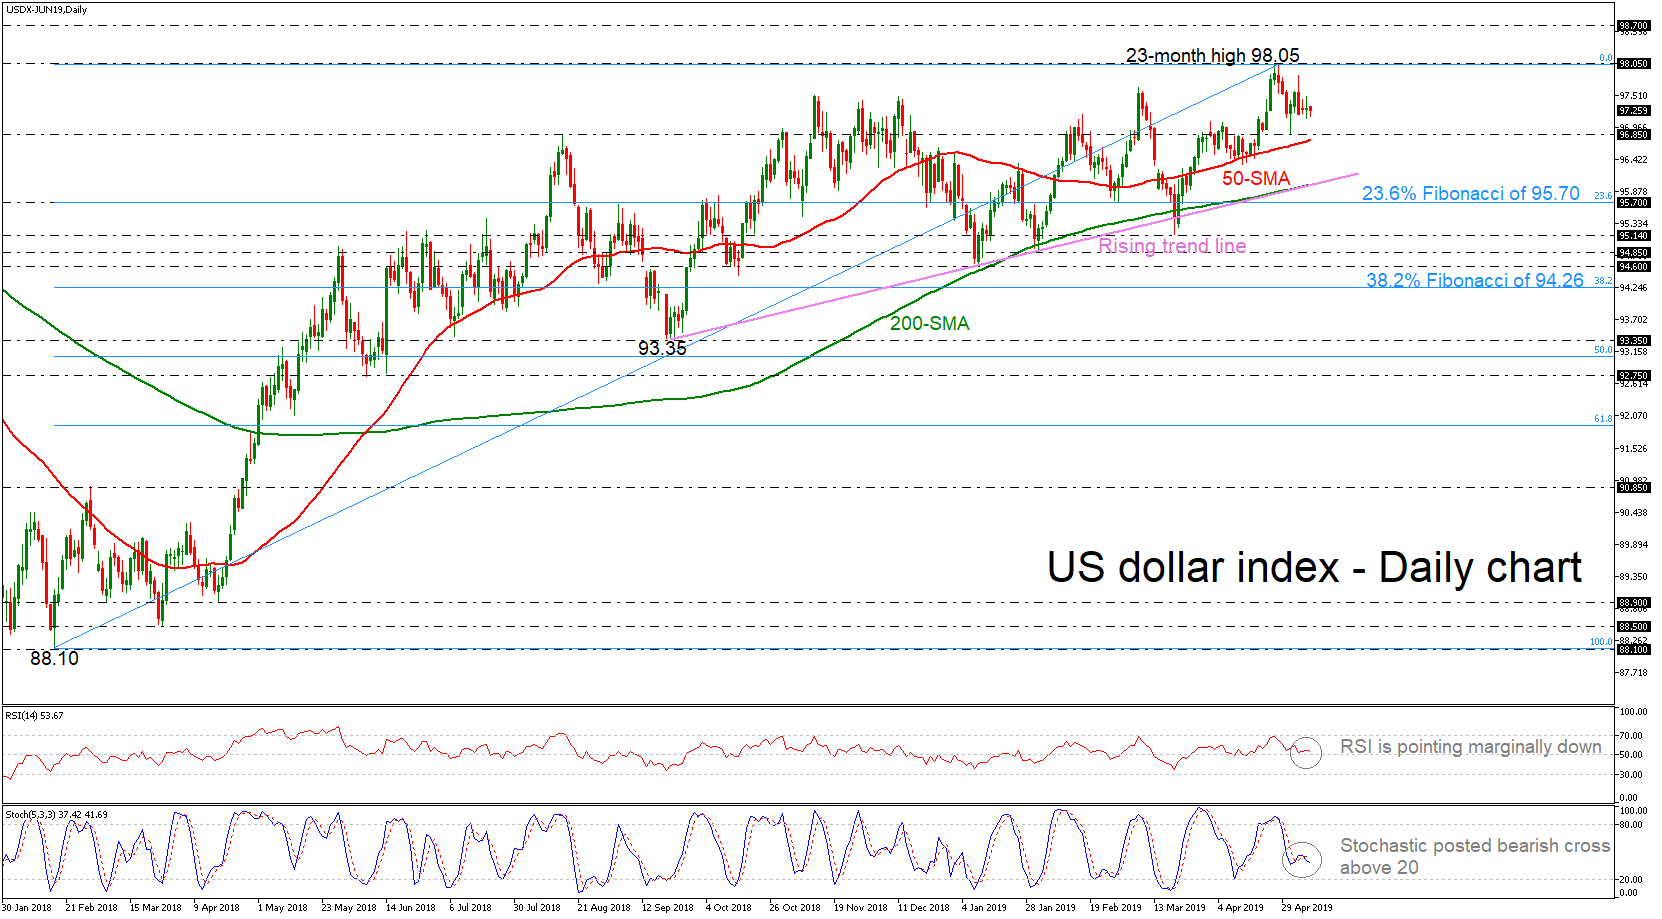
The US dollar index has reversed back down after finding resistance at the 23-month high of 98.05 achieved on April 25. However, the price has remained above the 50-day simple moving average (SMA) over the last five weeks as well as above the uptrend line, which has been standing since September 2018, suggesting upside tendency in the medium term.
The short-term bias is tilted to the downside as the RSI indicator is turning marginally lower near its 50 level, while the stochastic oscillator posted bearish crossover within the %K and %D lines above the oversold territory.
If the price continues the bearish retracement, support is coming at the 96.85 level, which stands slightly above the 50-day SMA. More losses could challenge the uptrend line, which overlaps with the 200-day SMA, currently at 95.95.
On the other hand, if the index returns higher, the 23-month high of 98.05 could attract traders’ attention and any violation above this hurdle could open the way for the 98.70 resistance, posting a higher high in the long term.
In the bigger picture, the dollar index has held in an upside tendency, however, looking at the very short-term, the price is posting a bearish correction and there is a chance of hitting the ascending line once again, before returning higher.


