
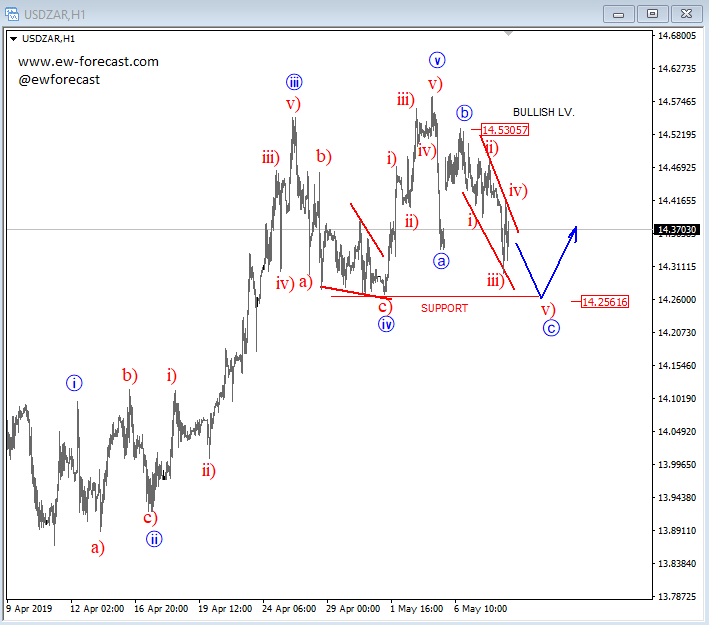
USDZAR is trading bullish but currently price may slow down in an a-b-c correction, where ideal support would be around previous wave »iv« and 14.25 level. But, any earlier strong rise back above 14.53 region would be an indication of a completed correction within uptrend.
USDZAR, 1h
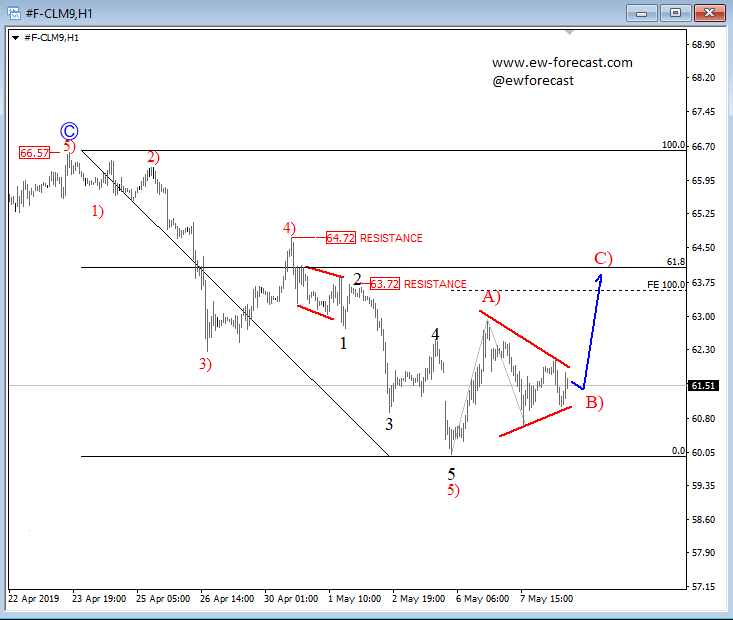
OIL can be finishing a small bullish triangle in wave B) that can send the price towards 61,8% Fibo. retracement and 63.70 – 64.70 resistance area for wave C), where a bigger three-wave correction within downtrend may come to an end.
Crude oil, 1h


