
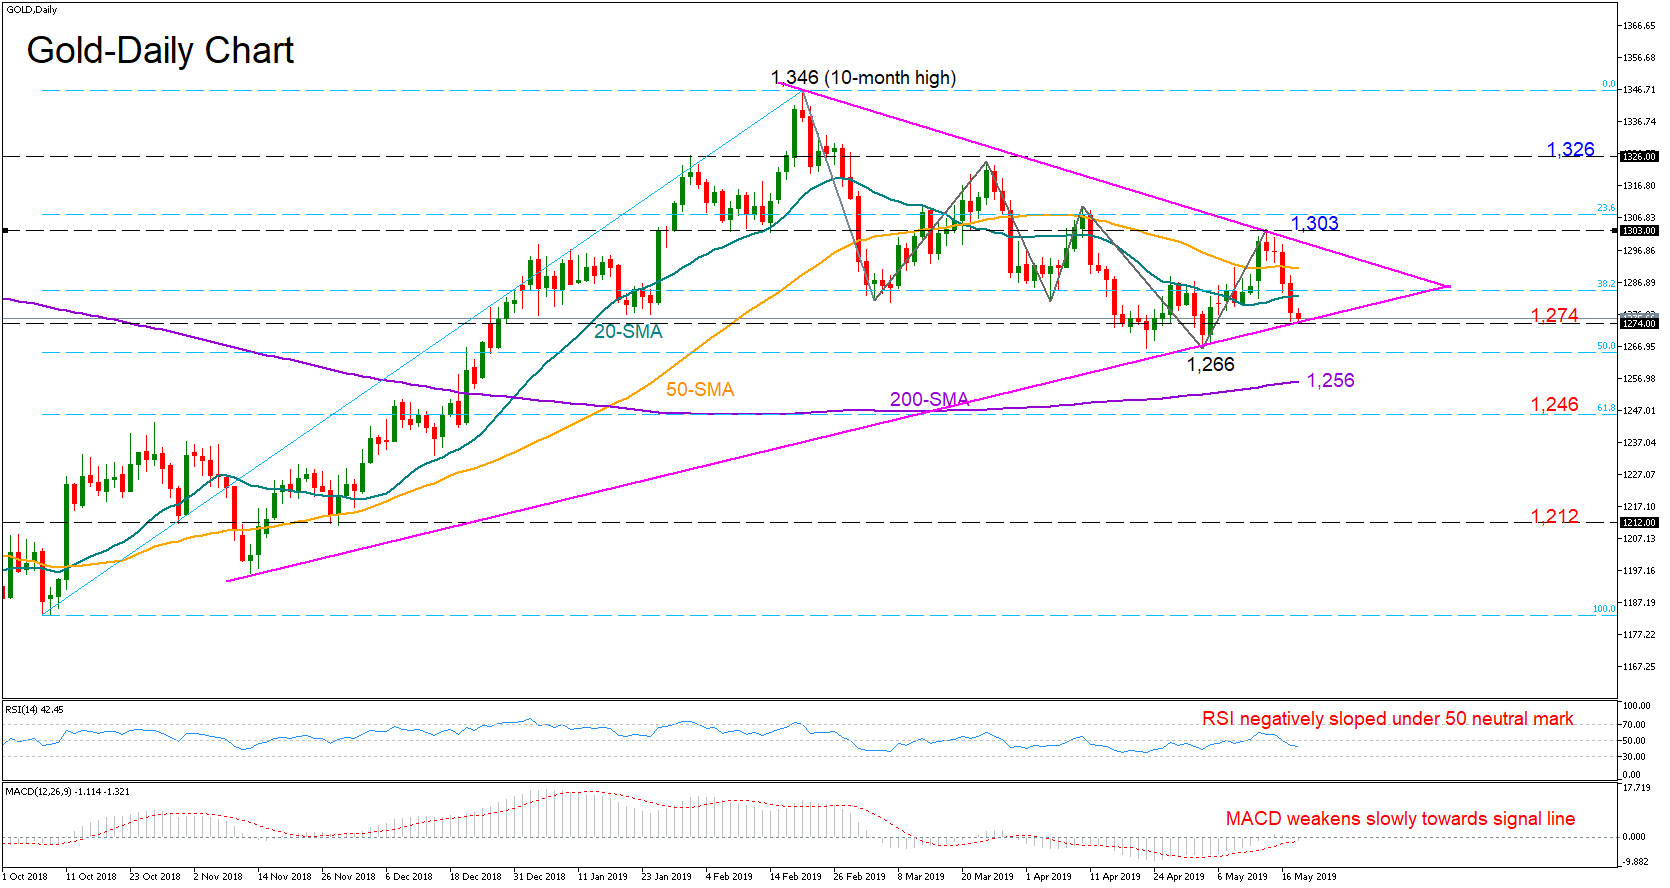
Gold made another lower high last week after finding resistance at 1,303.
The market action is currently taking place at the bottom of the symmetrical triangle and both the RSI and the MACD signal that the next move in the price is more likely to be on the downside as the former is negatively sloped below its 50 neutral mark and the latter continues to weaken slowly towards its red signal line.
While a cross under the triangle (1,274) could be discouraging, a decisive close under the previous low of 1,266, which is also the 50% Fibonacci of the upleg from 1,183 to 1.346 could give the green light for a steeper decline. Should the bears beat the 200-day simple moving average. (SMA) currently around 1,256, the February downtrend may turn more permanent, pushing support towards the 61.8% Fibonacci of 1,246 and 1,212.
Alternatively, for investors to resume a strong buying interest, the price would need to stage a descent rally above the triangle and the previous high of 1.303. Another key resistance is also located around 1,326, while higher the bulls would have to fight harder to overcome the 1.346 top.
In the medium-term picture, the sentiment remains bearish as long as the market keeps stretching it’s February downward pattern. The reducing distance between the 50- and the 200-day SMAs could be also a sign for caution.


