
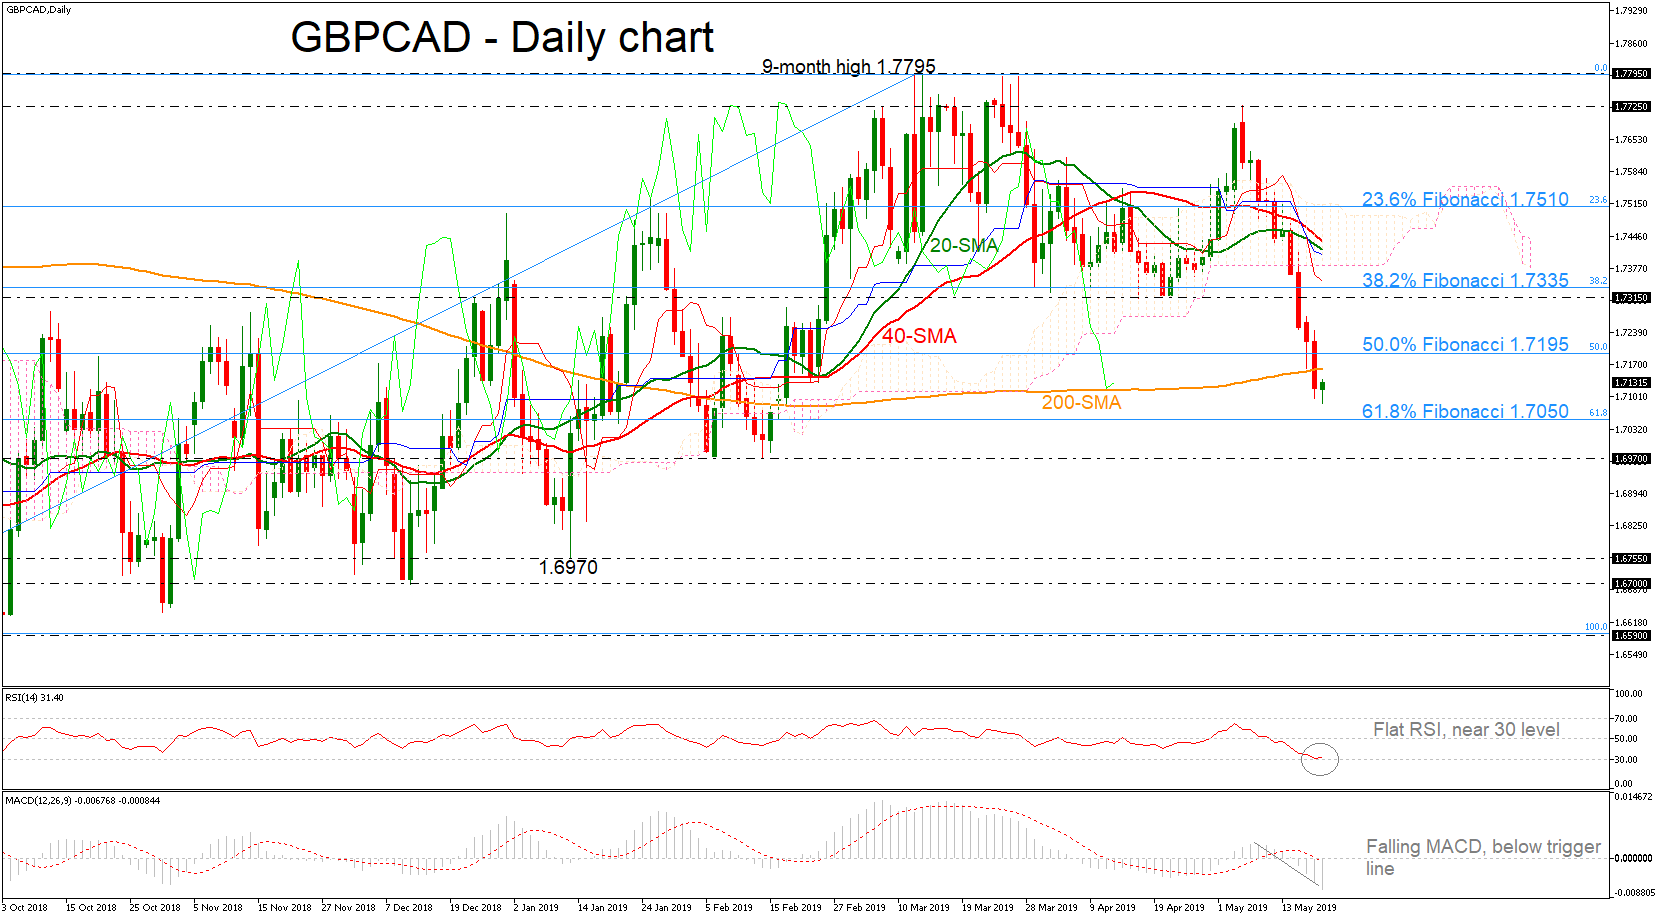
GBPCAD plunged below the 50.0% Fibonacci retracement level of the upleg from 1.6590 to 1.7795 and the 200-day moving average. Currently, the price is developing beneath the Ichimoku cloud, while the 20- and 40-simple moving averages (SMAs) are turning lower. The RSI indicator is flattening just above 30 oversold level while the MACD is strengthening its negative momentum.
In case of more decreases, the price could meet the 61.8% Fibonacci of 1.7050, posting a new three-month low. A break lower, could last until the 1.6970 support, identified by the lows on February 14.
Alternatively, if the pair changes its short-term direction to the upside, the bulls would probably challenge the 200-day SMA, currently at 1.7160, before touching the 50.0% Fibonacci of 1.7195. More bullish actions could push the market until the 1.7315 resistance.
In brief, in the short-term picture, the negative tendency is still in play following the pullback on 1.7725, while in the medium-term timeframe the market holds neutral unless the price drops below 61.8% Fibonacci, in which case the outlook would turn bearish.


