
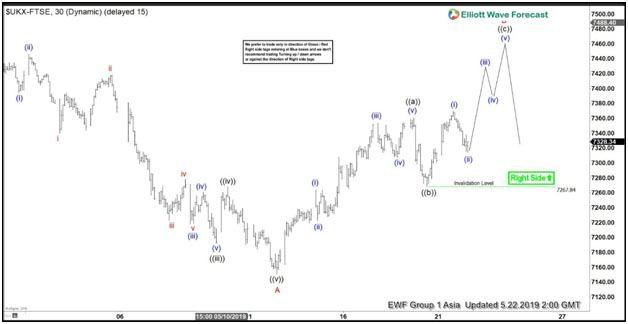
Short term Elliott Wave view in FTSE calls the move lower to 7150.9 on May 13 as wave A. This suggests that the move lower from April 23 is unfolding as a zigzag Elliott Wave structure. Wave B bounce is currently in progress to correct cycle from April 23 high before the Index turns lower. Internal of wave B is unfolding as another zigzag Elliott Wave structure in lesser degree.
Up from 7150.9, wave ((a)) ended at 7360.34 and wave ((b)) ended at 7267.84. Wave ((a)) unfolded as 5 waves where wave (i) ended at 7264.18 and wave (ii) ended at 7223.08. Index then resumes higher in wave (iii) which ended at 7353.51, wave (iv) ended at 7307.33. and wave (v) of ((a)) ended at 7360.34. While short term dips stay above 7267.84, expect Index to extend higher. Potential target for wave ((c)) of B comes at 100% – 123.6% extension of ((a)) which is 7480 – 7529. Index also should not break above May 13 at 7528.93 or else it will open further upside. If Index instead breaks below 7267.84, then either wave ((b)) is unfolding as an expanded Flat structure or wave ((c)) of B truncates and Index has turned lower.


