
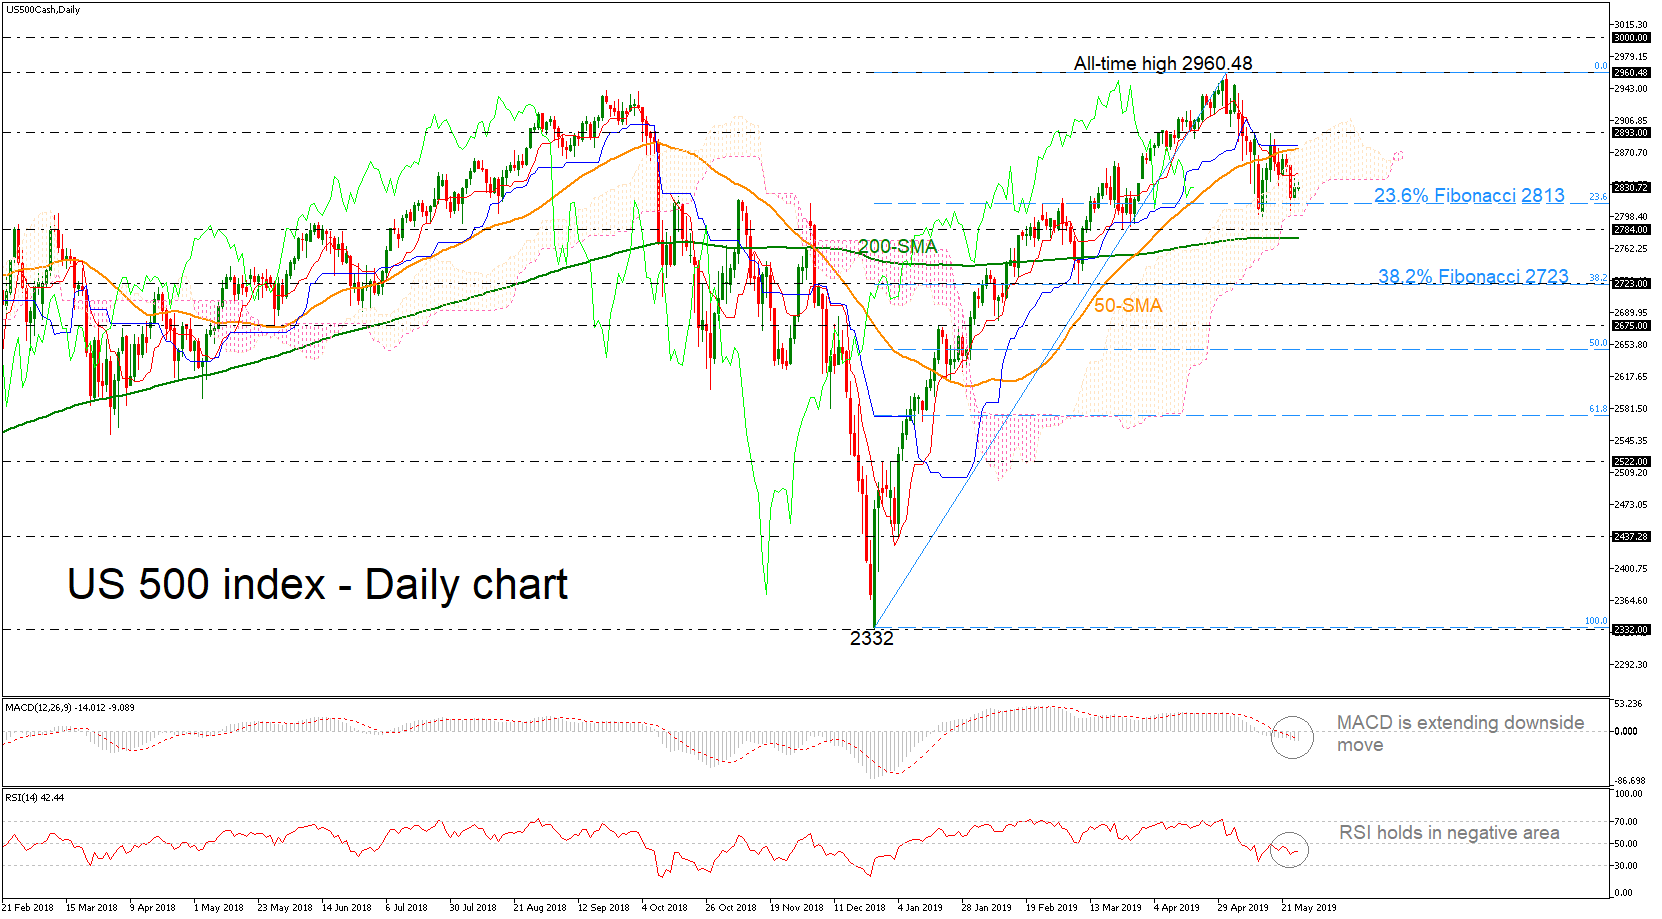
The US 500 stock index has declined considerably from the fresh all-time high of 2960.48, penetrating the Ichimoku cloud in the daily timeframe. The bearish correction picture in the short term is further supported by the MACD, which is falling below its red signal line and the RSI indicator which is turning slightly lower.
Should prices move lower, support could come at the 23.6% Fibonacci retracement level of the upleg from 2332 to 2960.48 around 2813 again. Below that, the 2784 is another major support before touching the 200-day moving average near 2774. A significant plunge below the 200-SMA could open the door for the 38.2% Fibonacci of 2723.
To the upside, initial resistance is coming from the 50-SMA currently at 2875 before meeting the 2893 resistance. More bullish speculation could meet the all-time high of 2960.48.
Summarizing, in the near-term, the momentum indicators point to a possible bearish retracement, however, the index is still creating higher highs and higher lows over the last four months, which augurs well for the medium-term. A decline below 200-SMA may turn traders’ attention to the downside.


